- Portal
- Mobile
DETAILED FINANCIAL FLOW
To access the Financial Flow screen, follow the steps below as shown in the images.-
Controllership> Financial Flow;
.png?fit=max&auto=format&n=OorSAChFNVfXfATx&q=85&s=b0e693f786919251d462d4f4c656c979)
-
Financial Flow Screen Configuration Bar, highlighting each interactive interface element. The image shows the steps for selecting stores, applying filters, defining a period, processing data, and accessing the documentation. It is ideal for helping new users correctly configure the financial analysis parameters.;
-1.png?fit=max&auto=format&n=OorSAChFNVfXfATx&q=85&s=b5328a9b8aaa9ea776e7f27fd6a6d302)
-1.png?fit=max&auto=format&n=OorSAChFNVfXfATx&q=85&s=f843ce42caa79b70f36847a35f61f1a1)
FINANCIAL FLOW GRID DETAILS
-
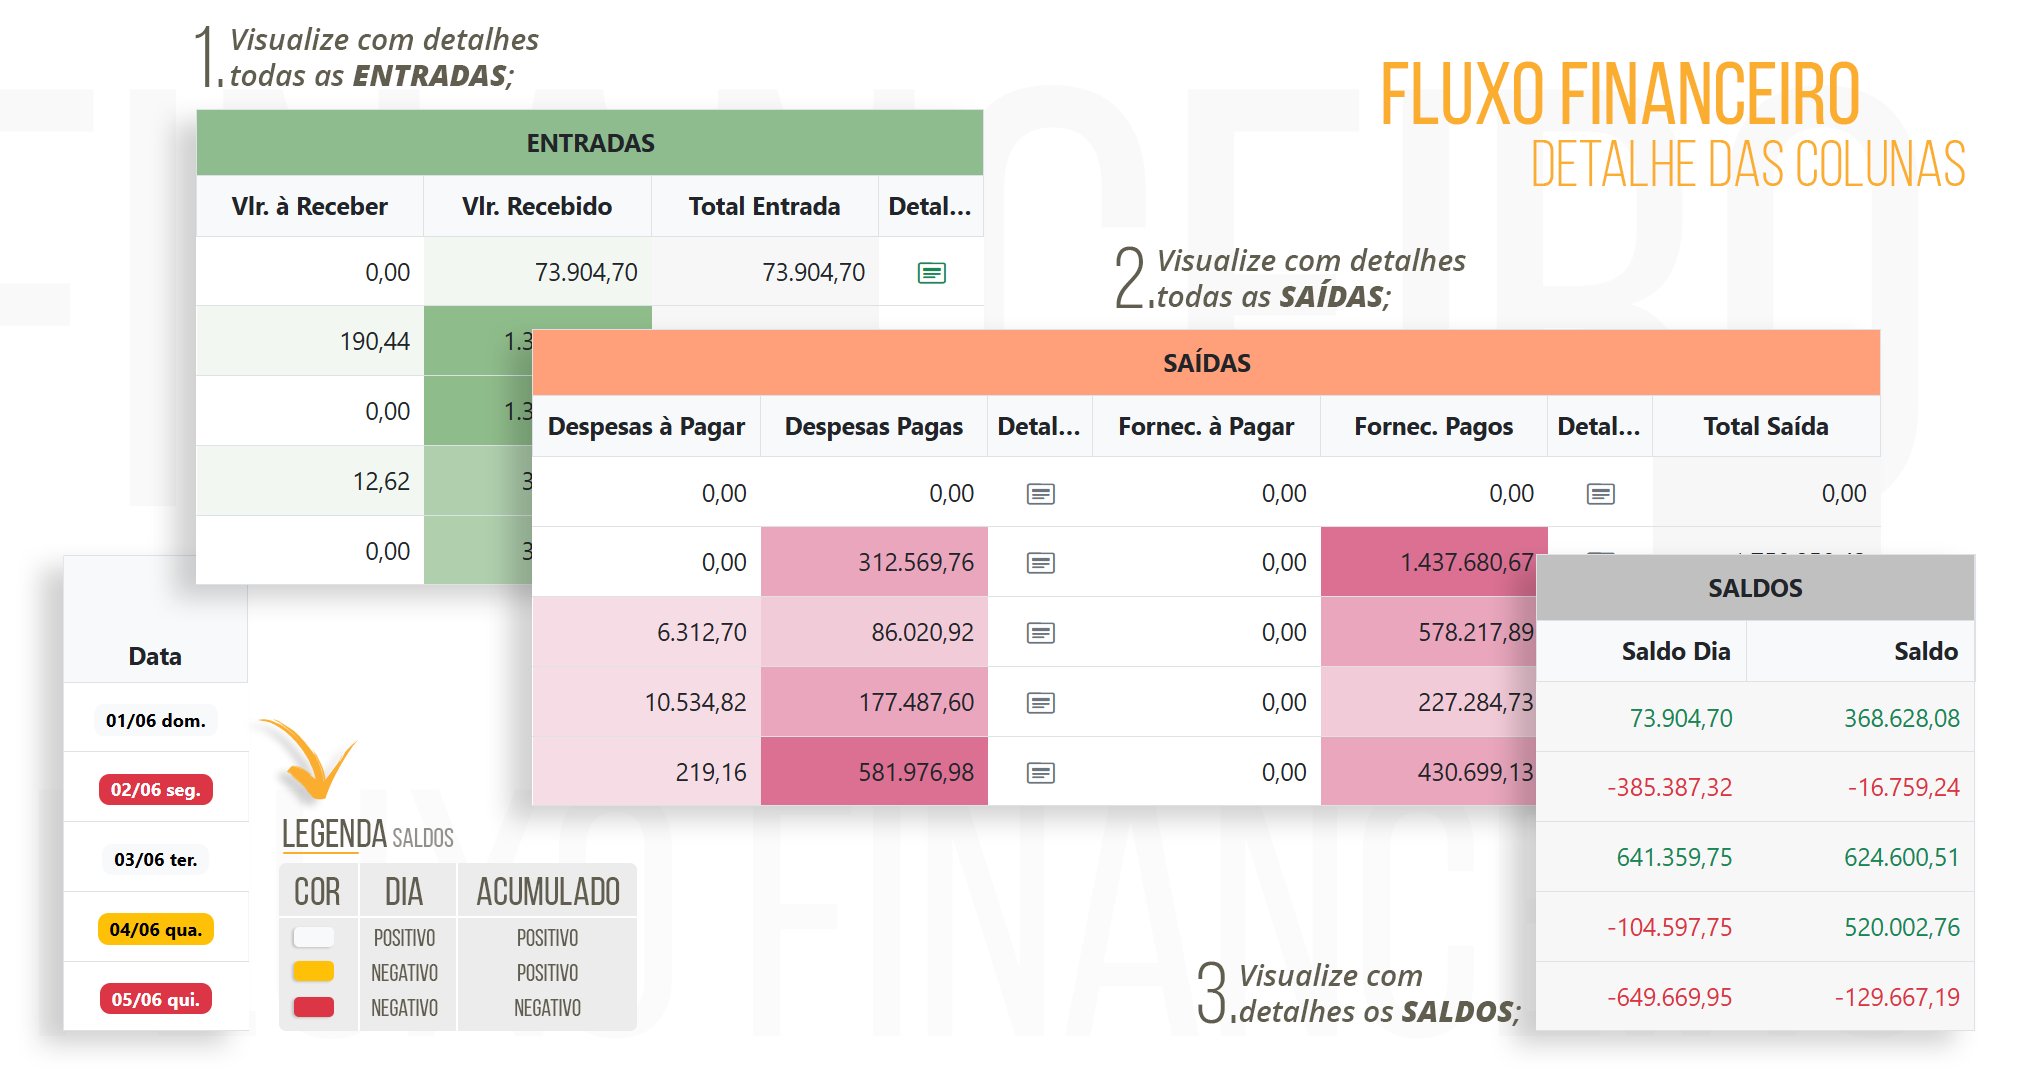
Image of a detailed daily financial flow table, displaying inflows, outflows, and balances by date in an organized manner. The table makes it possible to quickly identify the days with the most financial activity and analyze how the balance changes throughout the period. It is ideal for monitoring and financial decision-making.
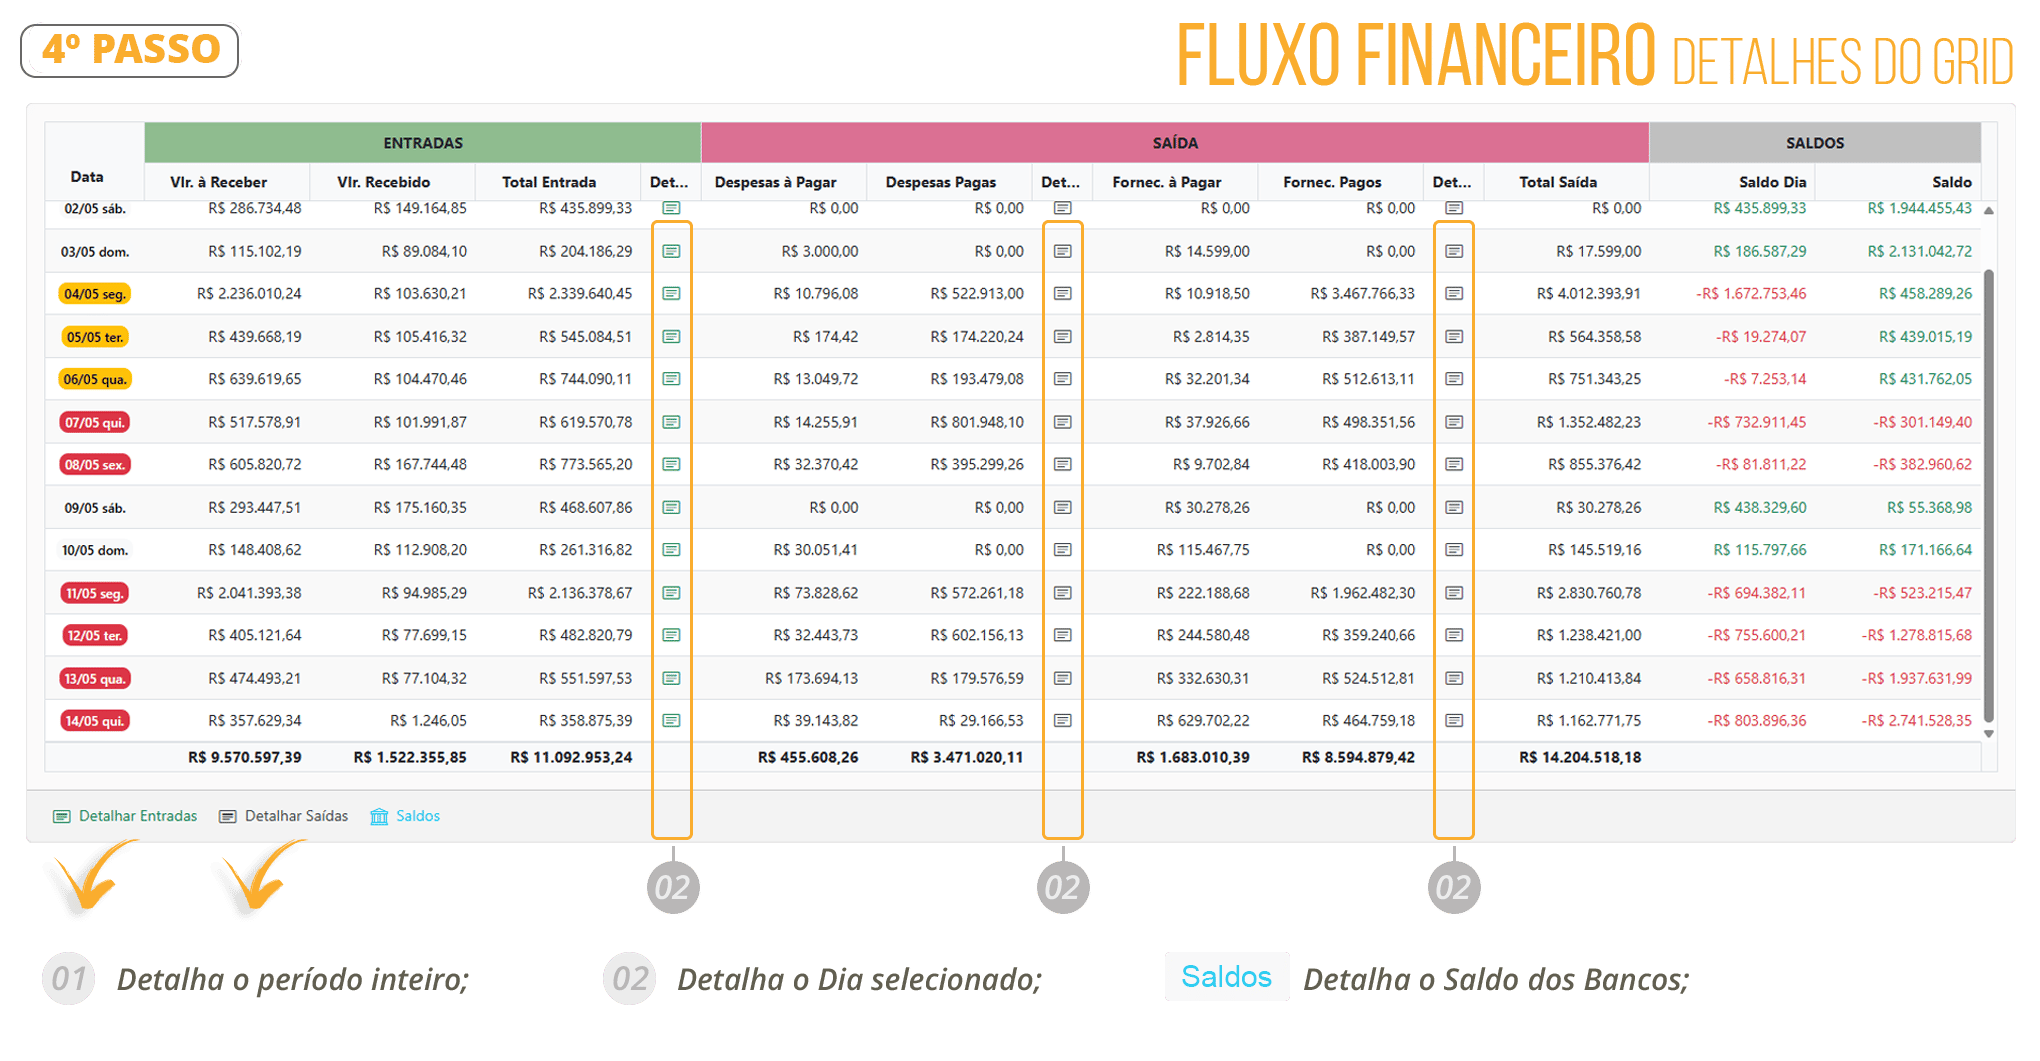
See the example in the image below;
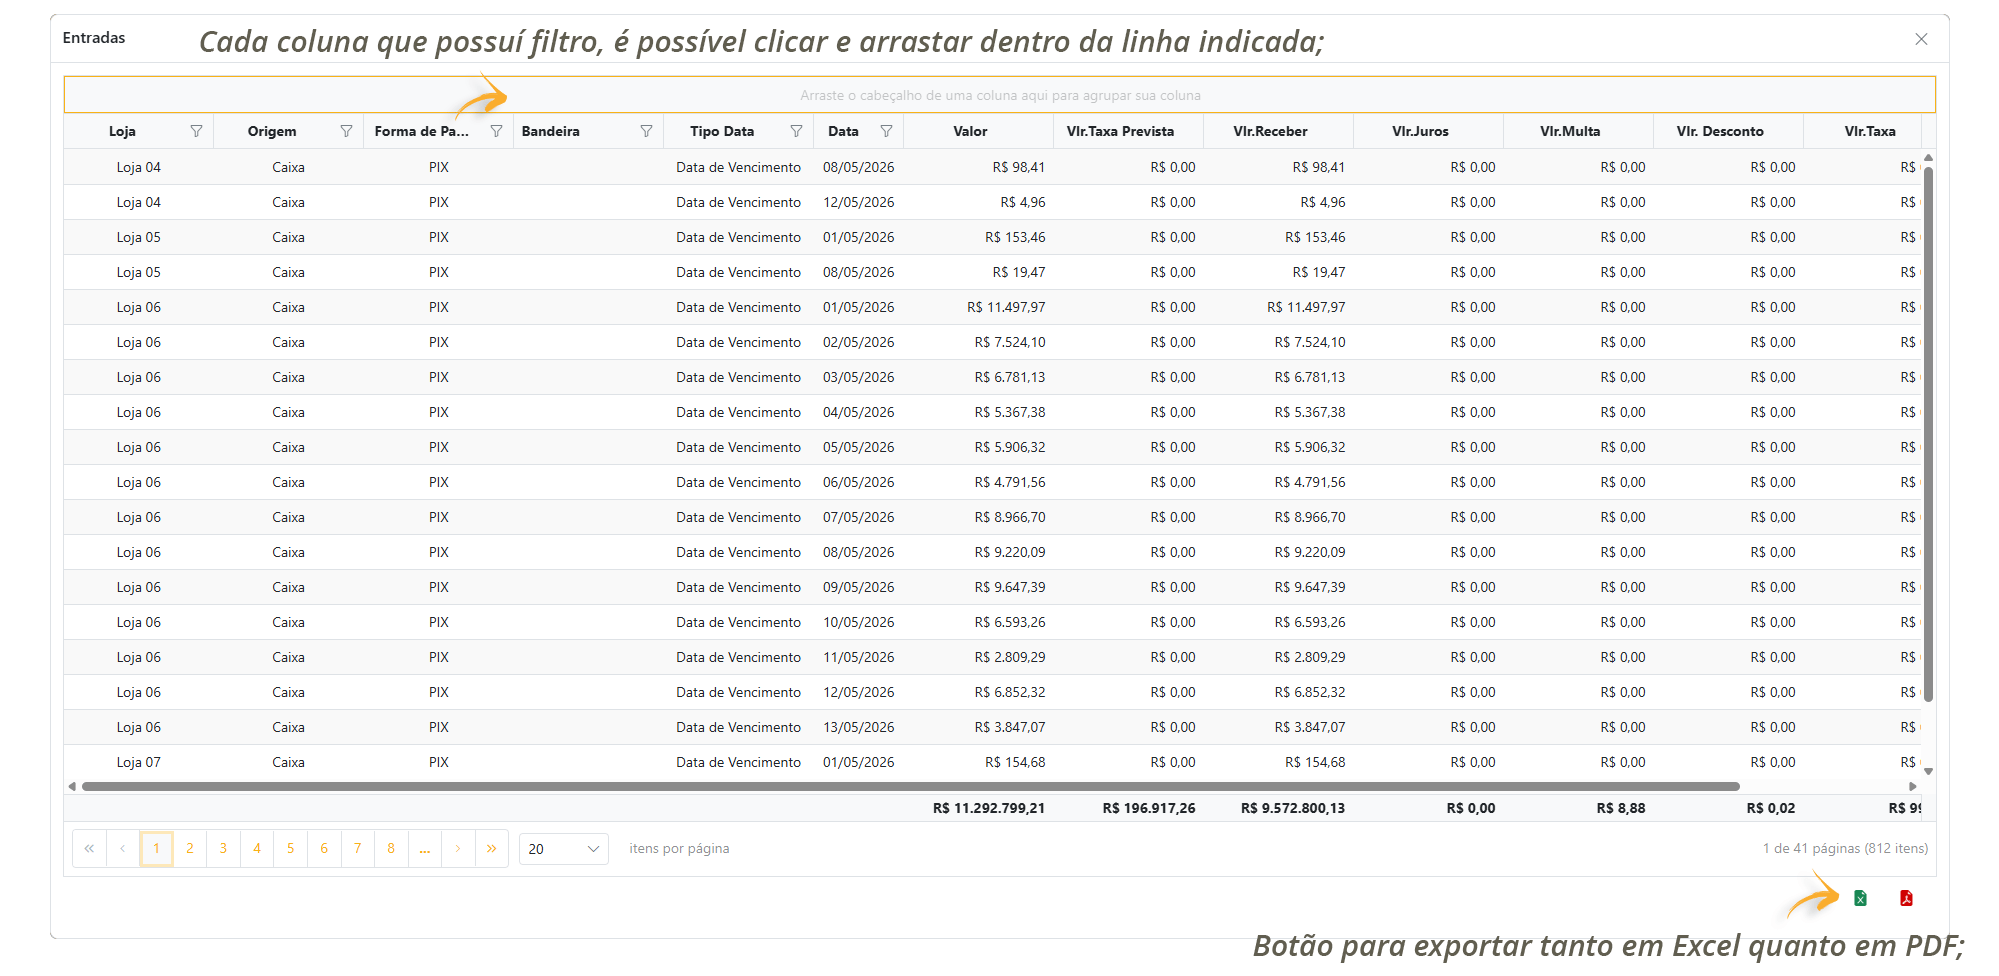
See the example in the image below;
FINANCIAL FLOW COLUMN DETAILS
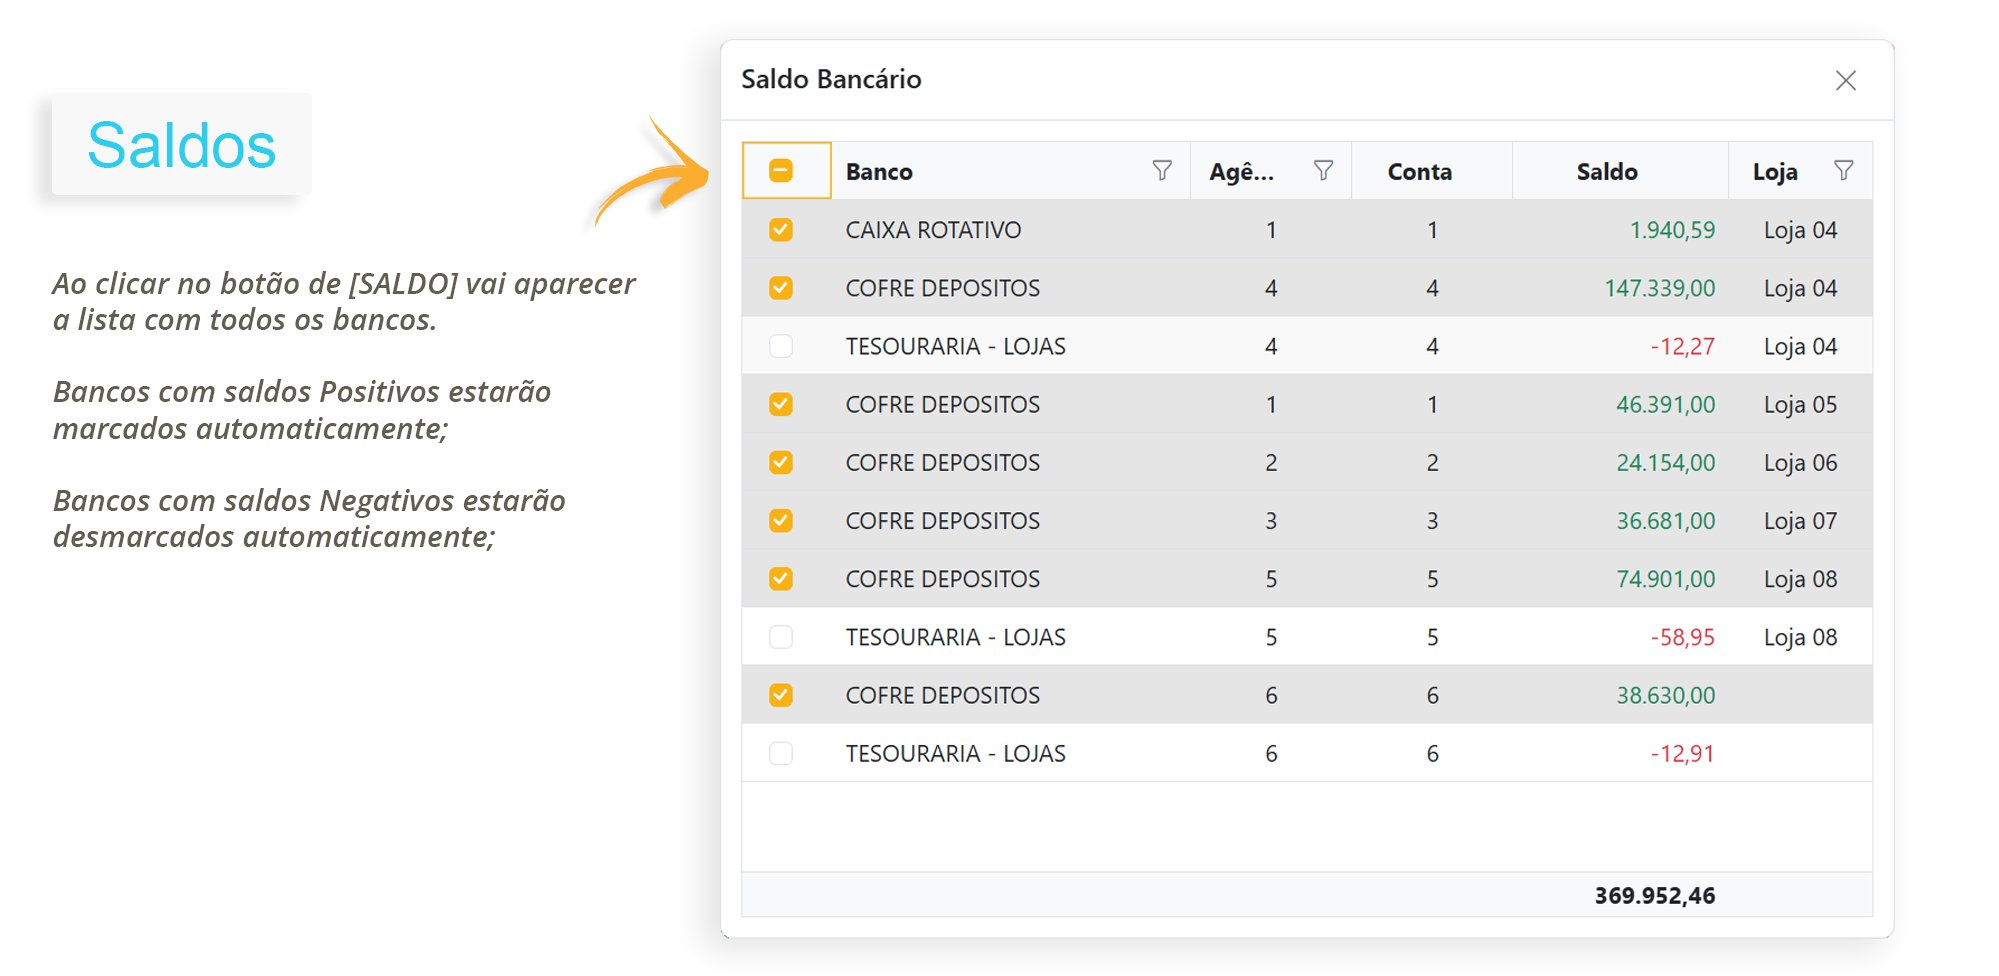
Column and Legend Details;Total Receivable and Received: Displays the amounts pending and received during the selected period.Total Payable and Paid: Displays financial obligations and payments already made.
Opening and Closing Balance: Shows the financial position at the beginning and end of the period.Detailed Inflows and Outflows: Allows you to view all transactions, including information about dates, amounts, and categories.
DASHBOARDS
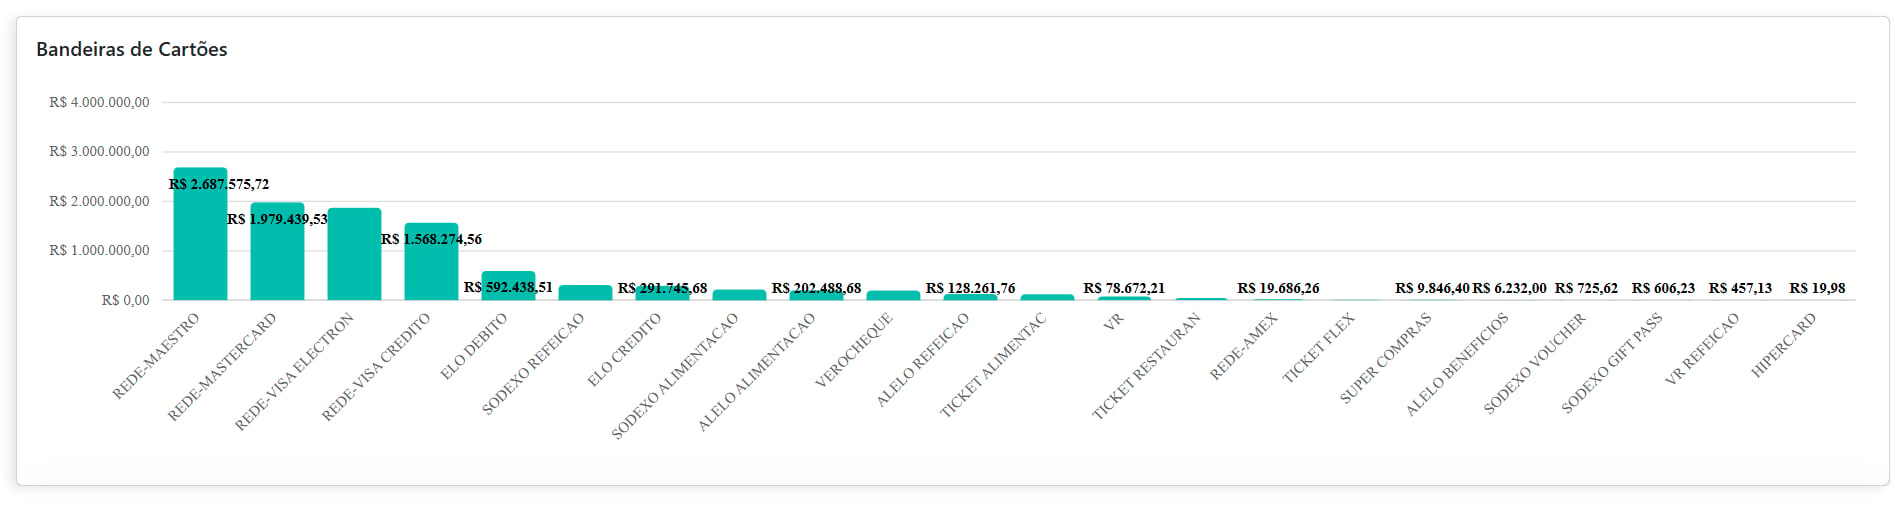
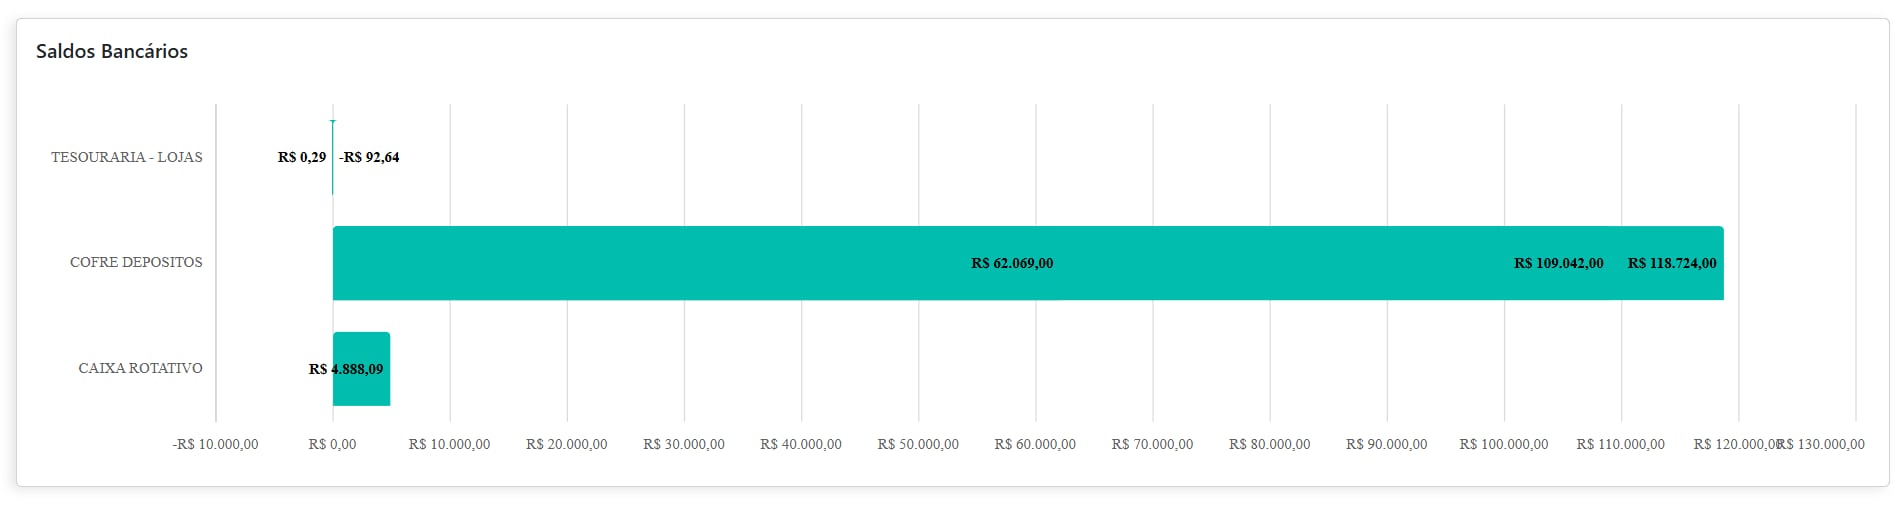
1.0 See the details of each Dashboard in the image below, which contains four comparative doughnut charts illustrating the proportions between pending and completed amounts in Financial Flow;These charts provide a quick visual overview of the company’s financial health.
.png?fit=max&auto=format&n=OorSAChFNVfXfATx&q=85&s=189f58b21bddbc9d0d506c56630e3ddc)
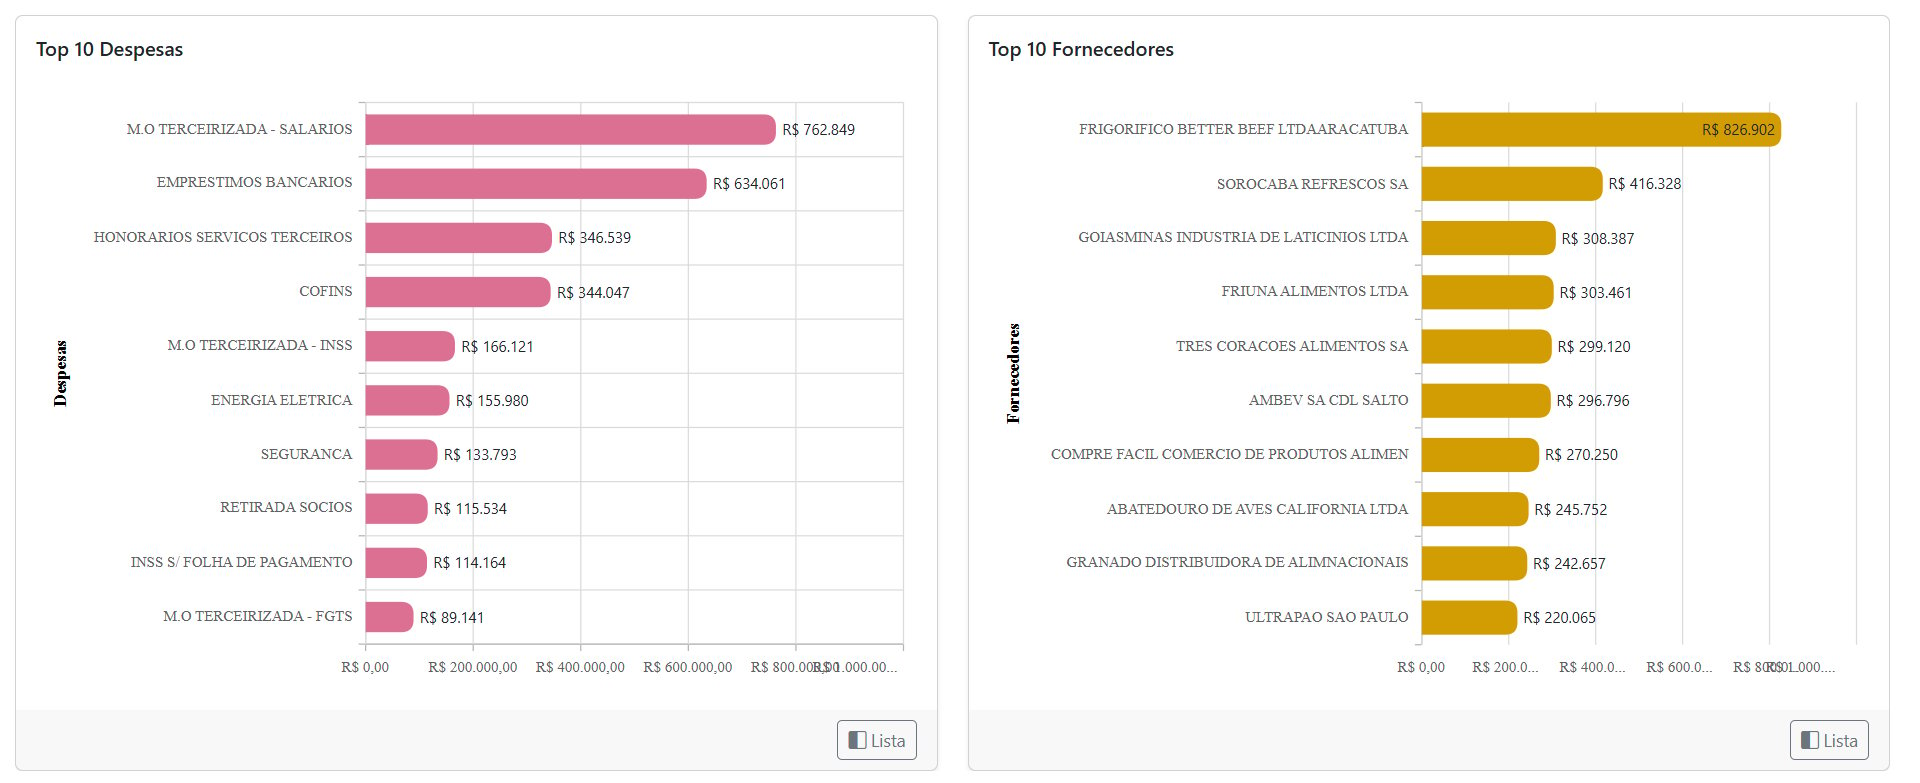
On the left, the “Top 10 Expenses” chart highlights the company’s main expense categories, such as outsourced labor costs and bank loans.
On the right, the “Top 10 Suppliers” chart displays the suppliers with the highest financial volume, making it possible to identify the most relevant partners during the analyzed period.
EXPENSE FORECASTS IN VR MASTER
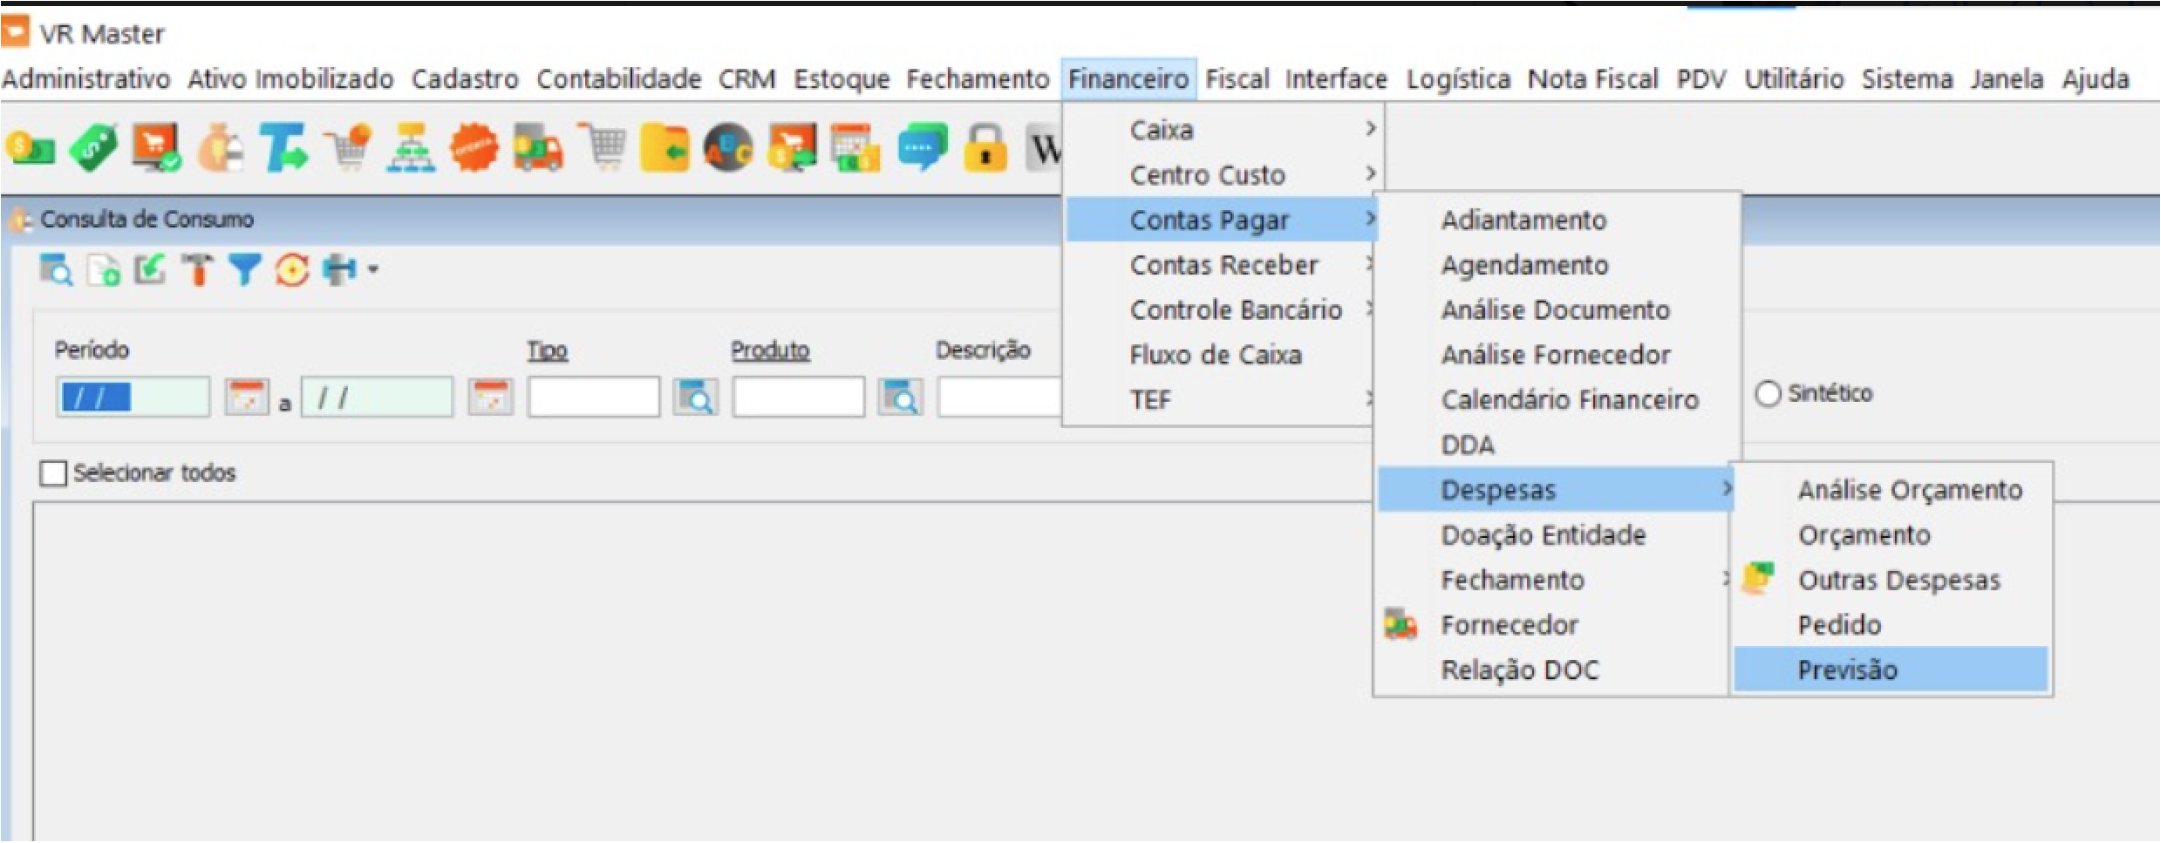
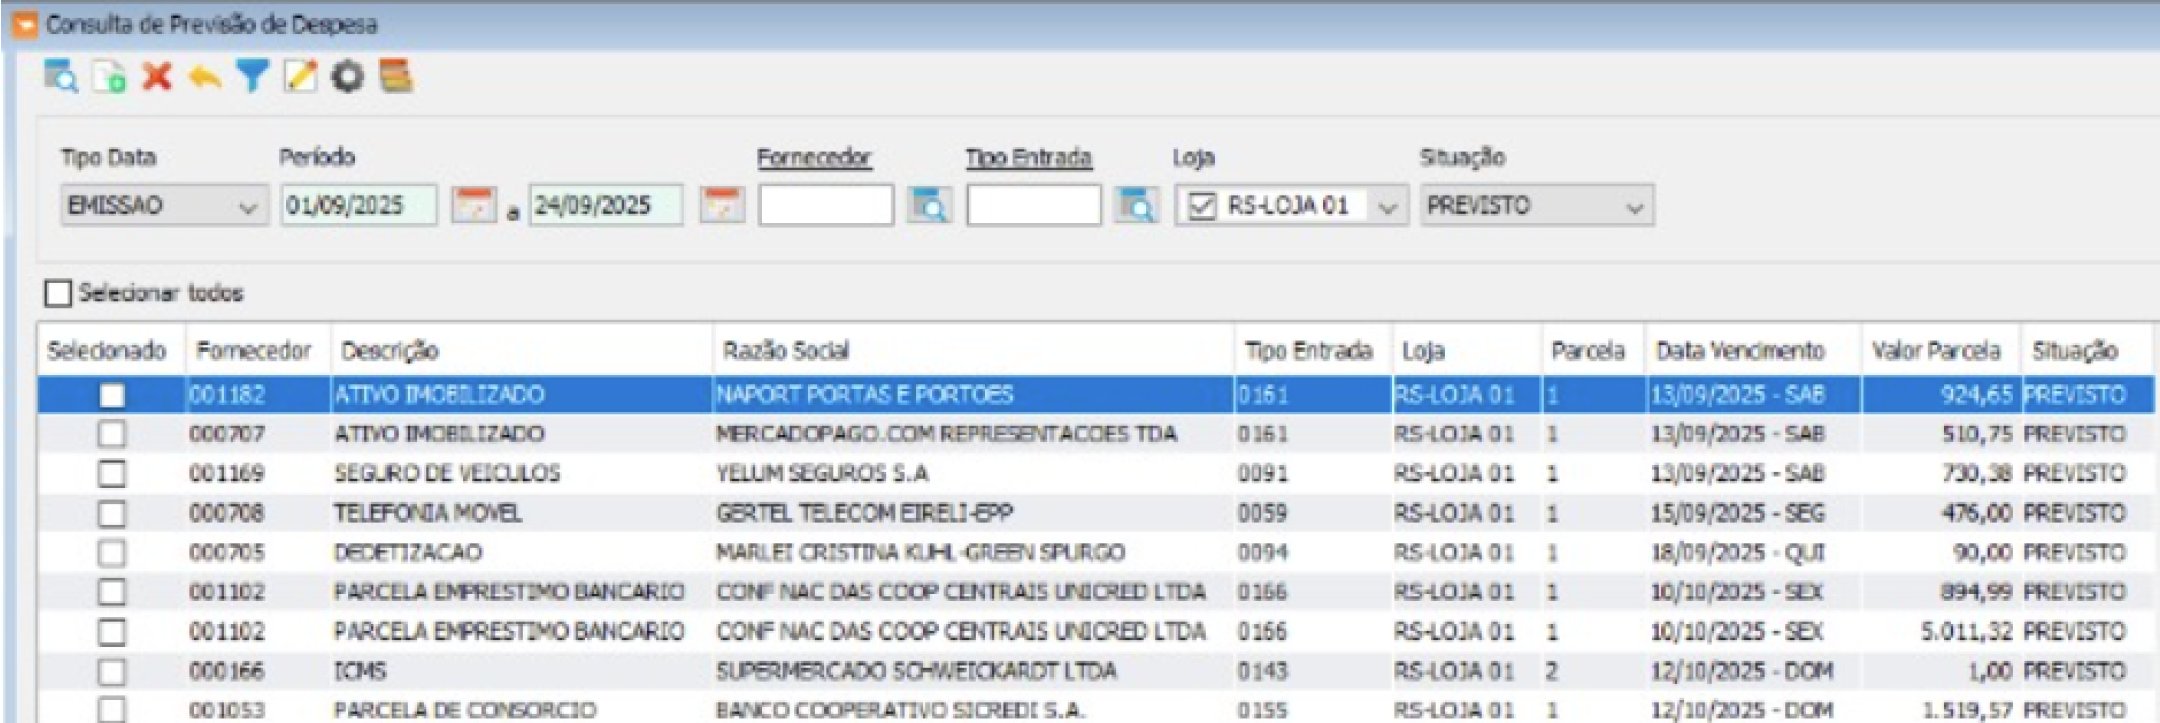
We enter expense forecasts in Master, but Financial Flow is not updated.Financial Flow is based on Accounts Payable. In this case, you must “generate” the entries and leave them open. The information will then be displayedMaster Expense Forecast Entry Procedure:
Financial / Accounts Payable / Expenses / Forecast;