
- Portal
- Mobile
Metrics
To learn more about Metrics, follow the steps below as shown in the images.-
Controllership> Metrics
.png?fit=max&auto=format&n=OorSAChFNVfXfATx&q=85&s=f98d95835418adfa0a739377c536747e)
-
Metrics home screen. See how each field works in the image below;
.png?fit=max&auto=format&n=MxGfRo8KrZylQJRB&q=85&s=d4ca2ecdee86095353be3ec2927fd32b)
-
See an example of the Metrics Main Screen;
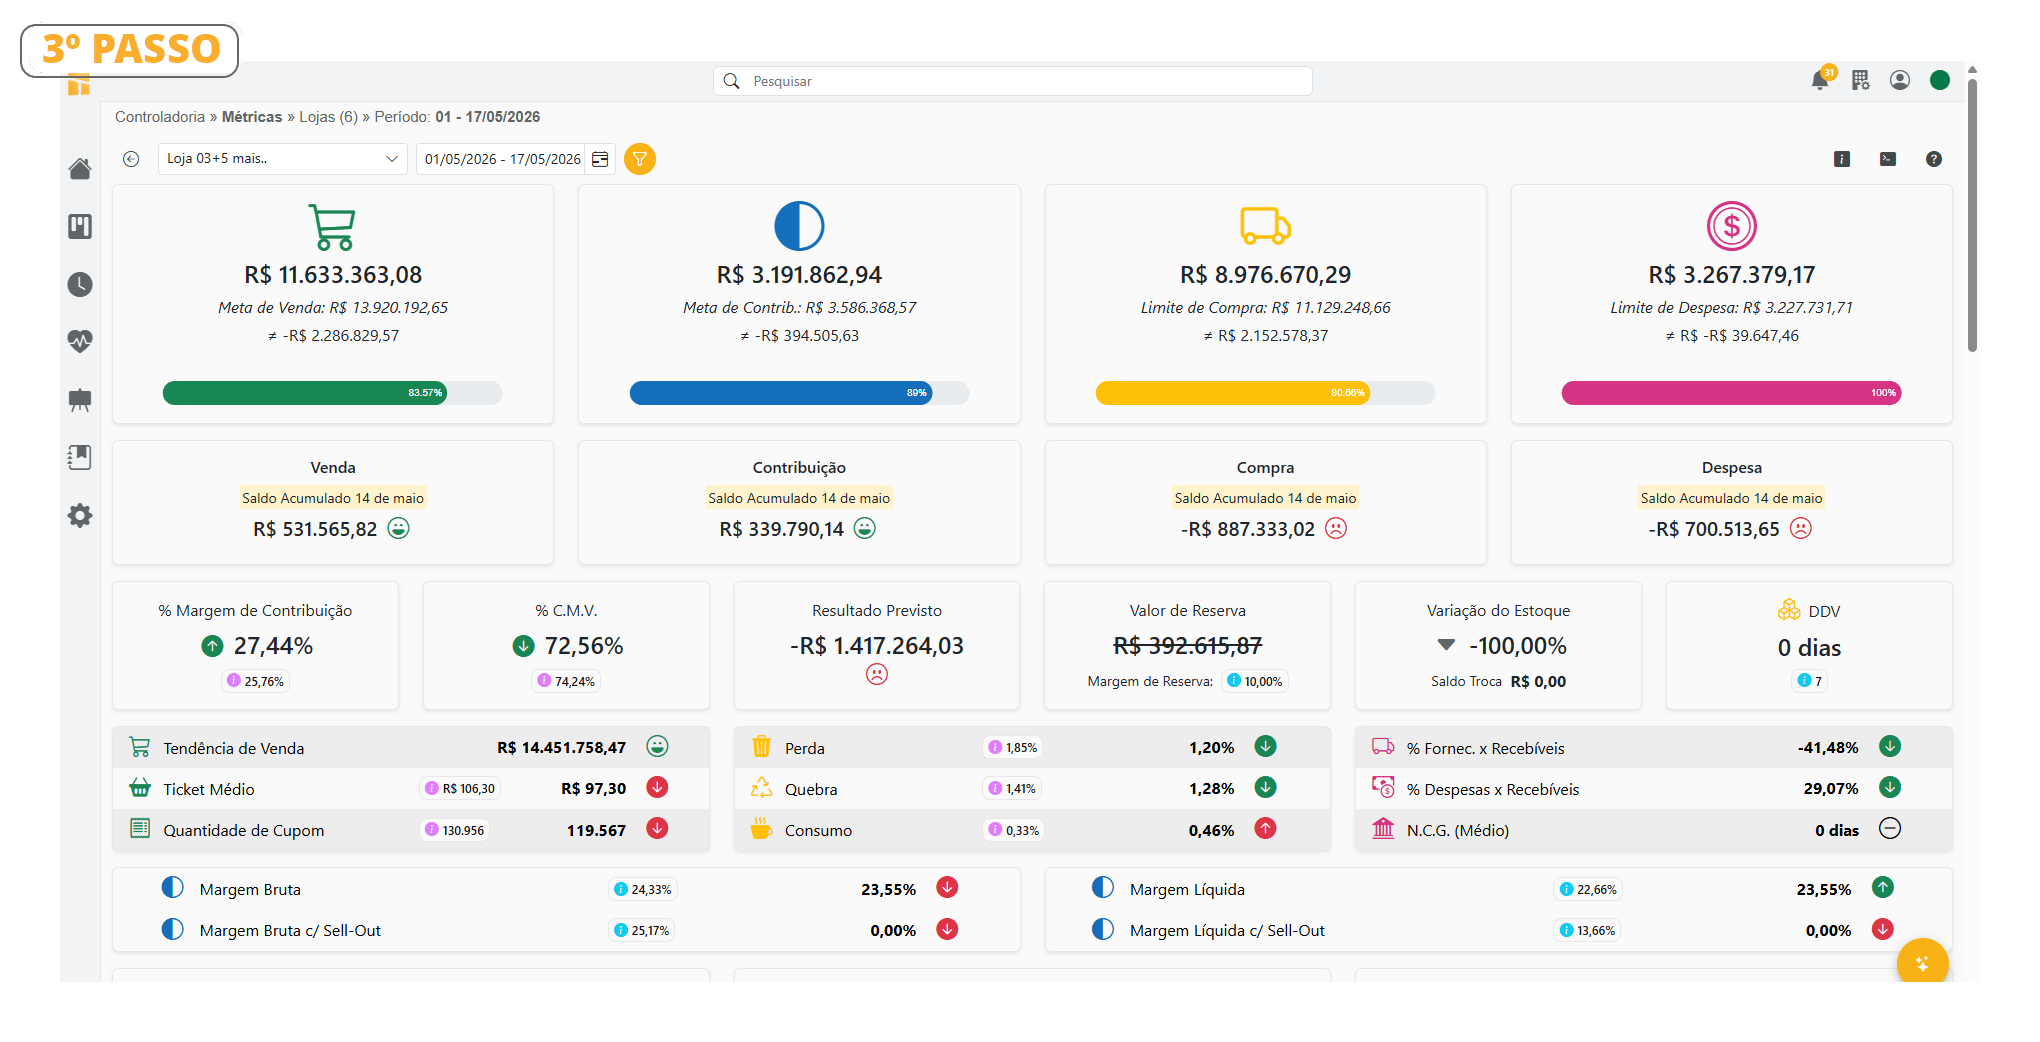
Details of the 4 Pillars
-
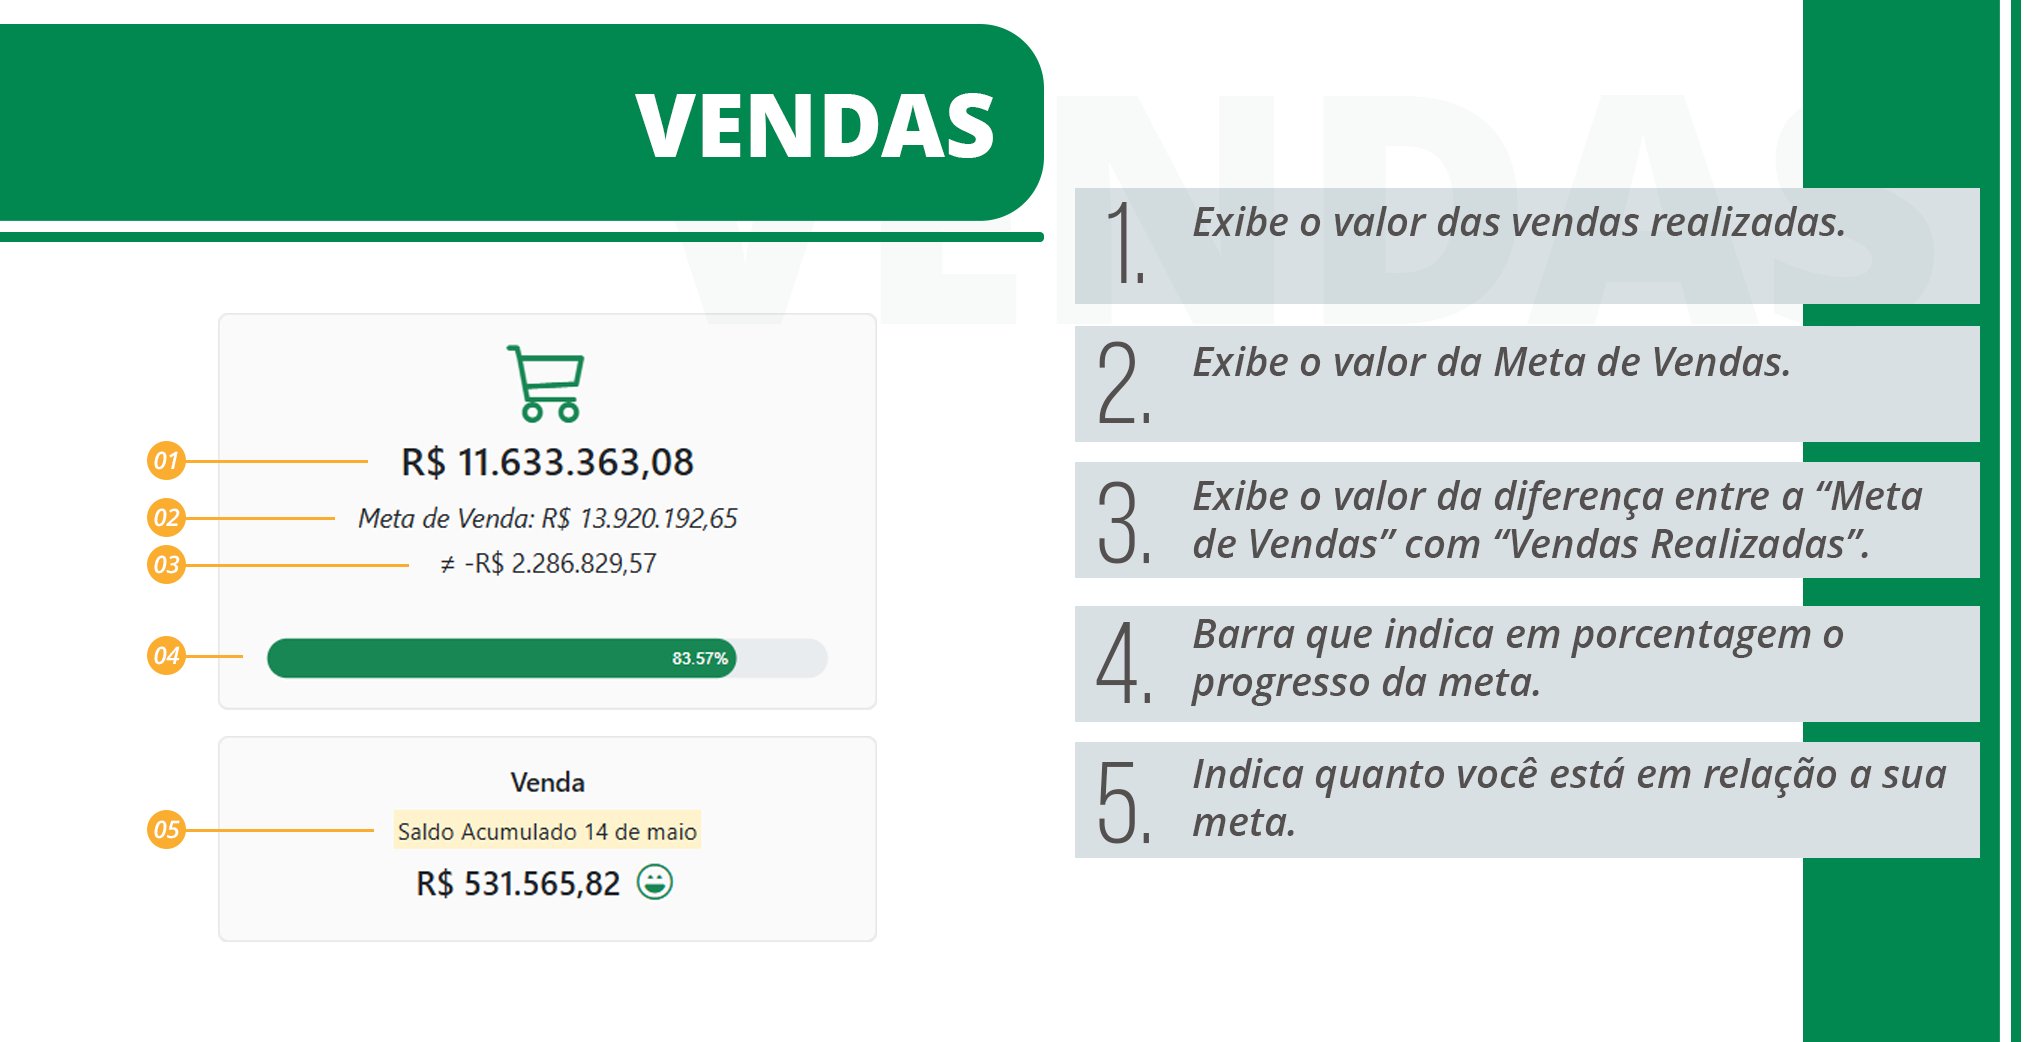
Sales Table Information
-
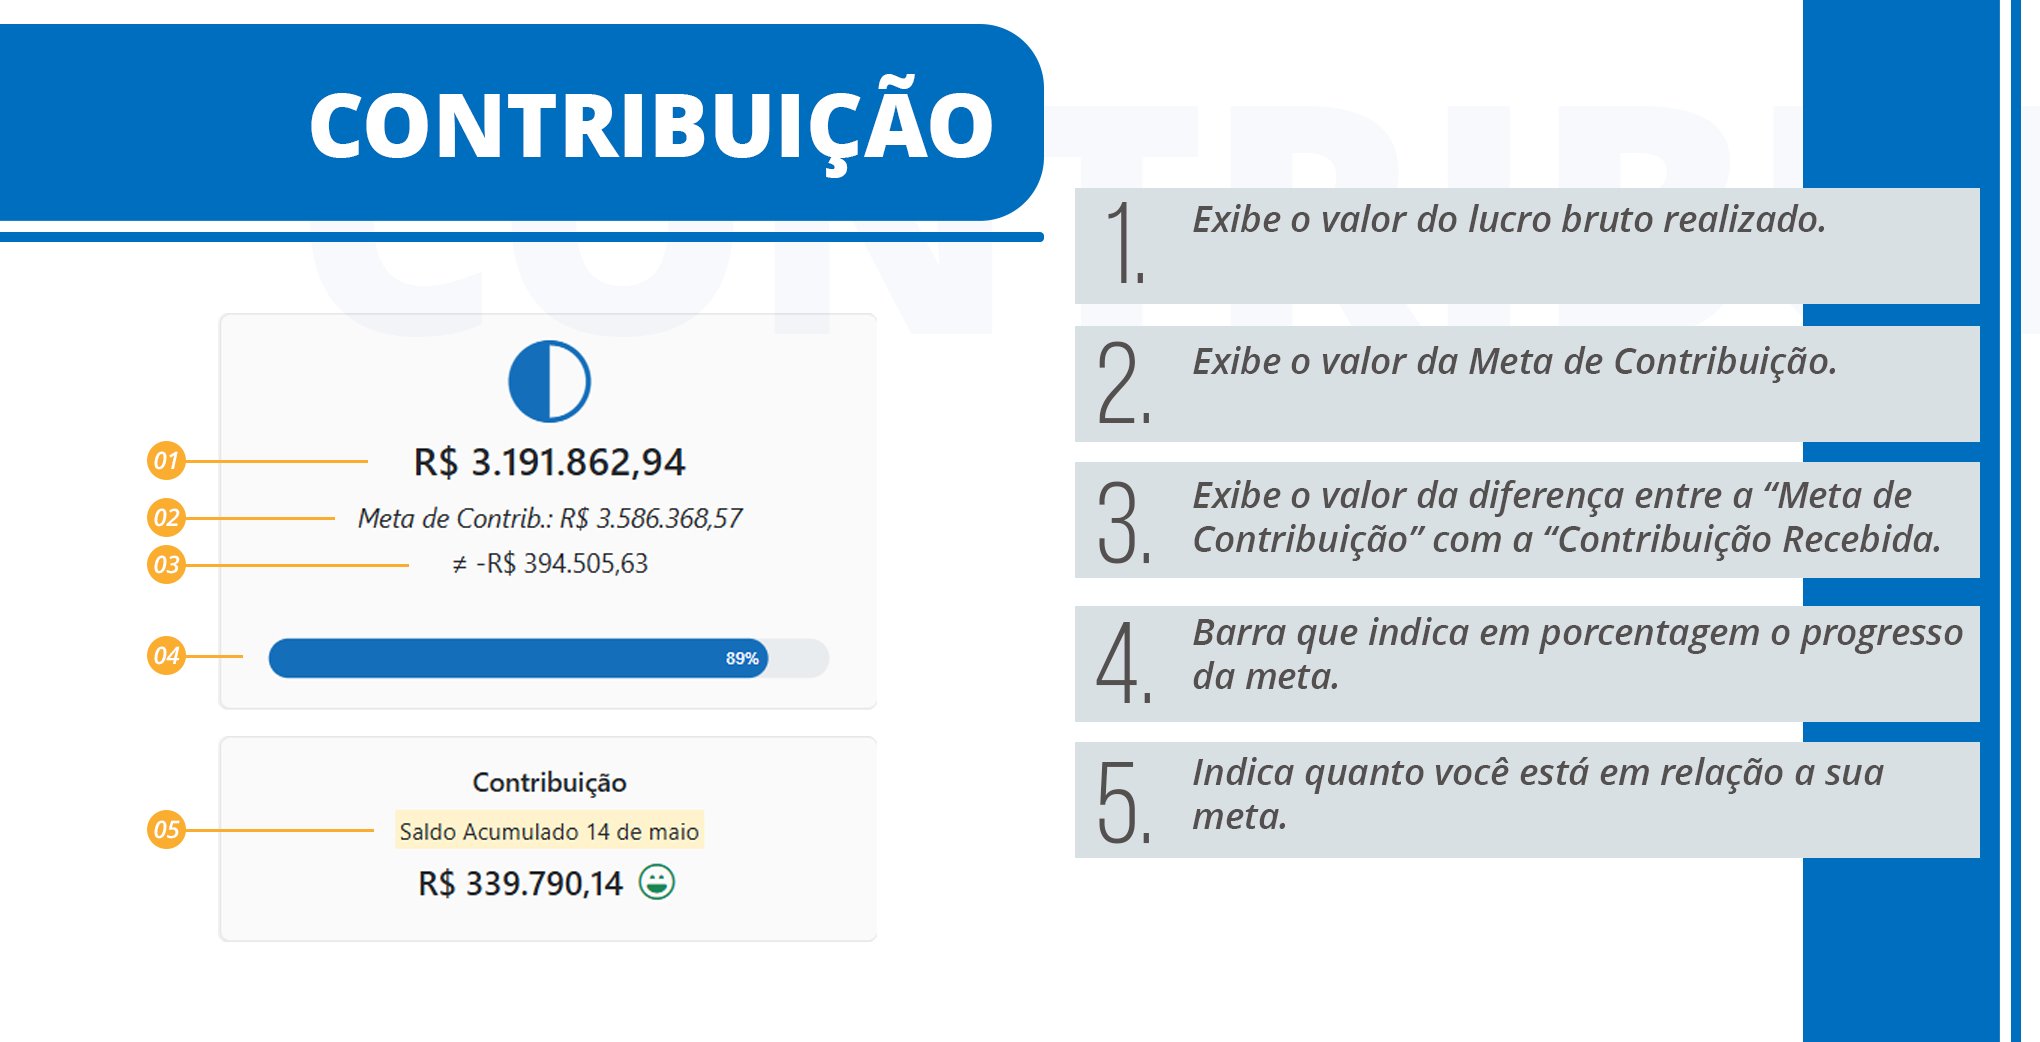
Contribution Table Information
-
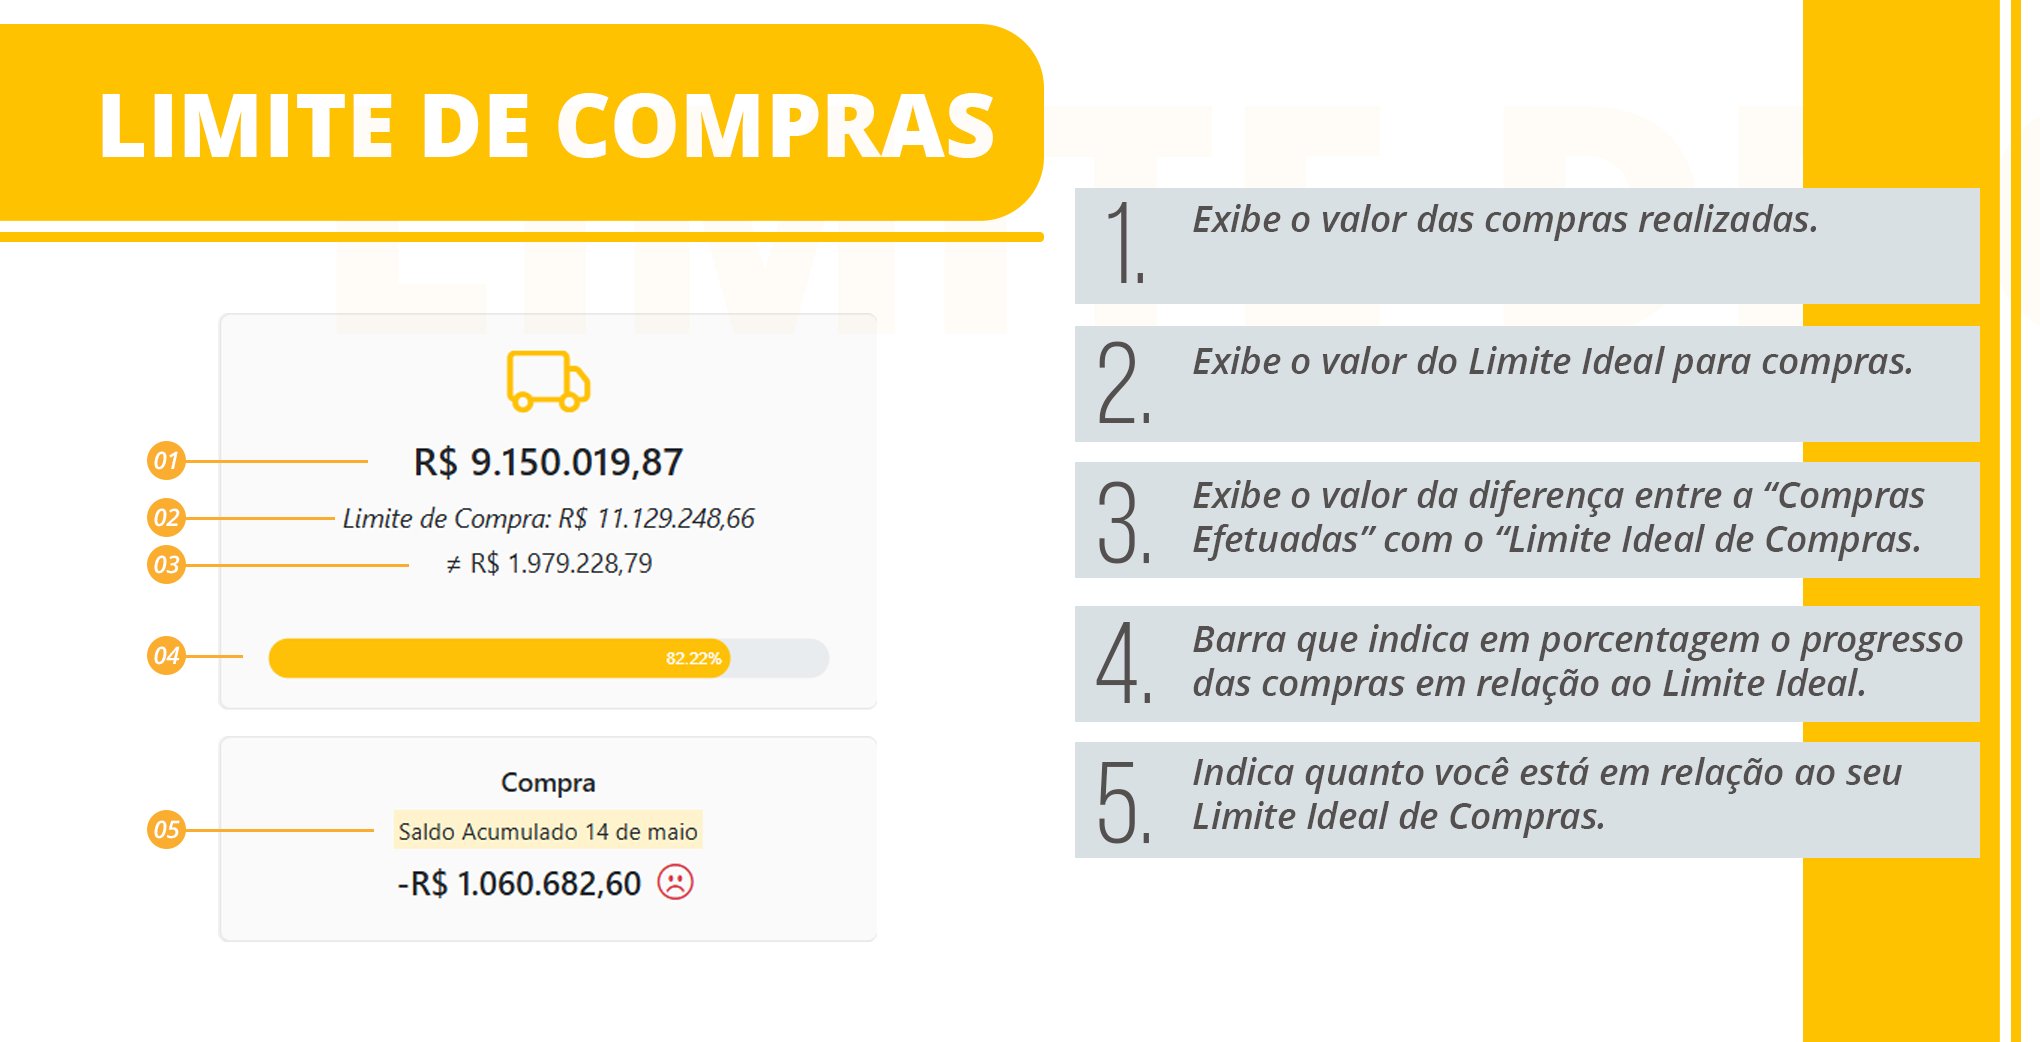
Purchase Limit Table Information
-
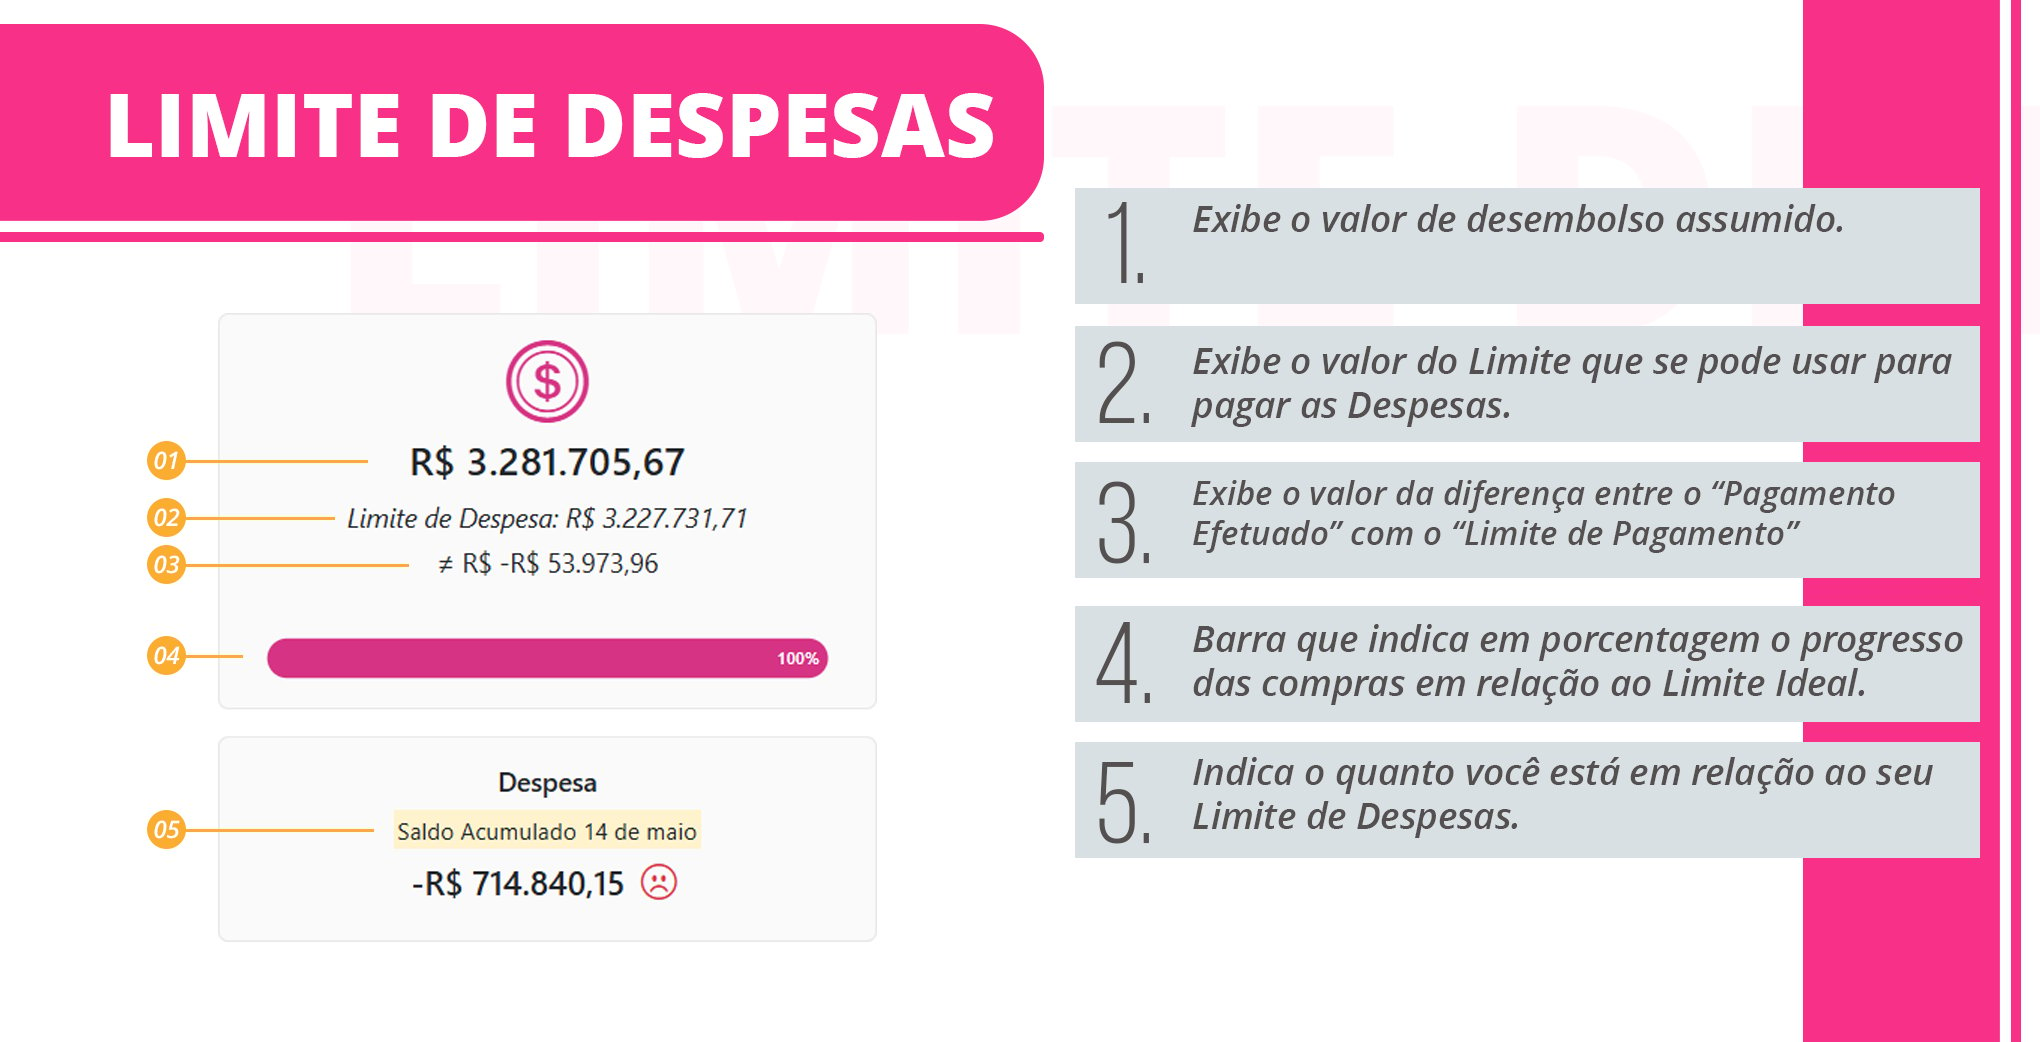
Expense Limit Table Information
The data comes directly from VR Master: [receberCaixa], [receberCheque], [receberCreditoRotativo], [receberVendaPrazo]
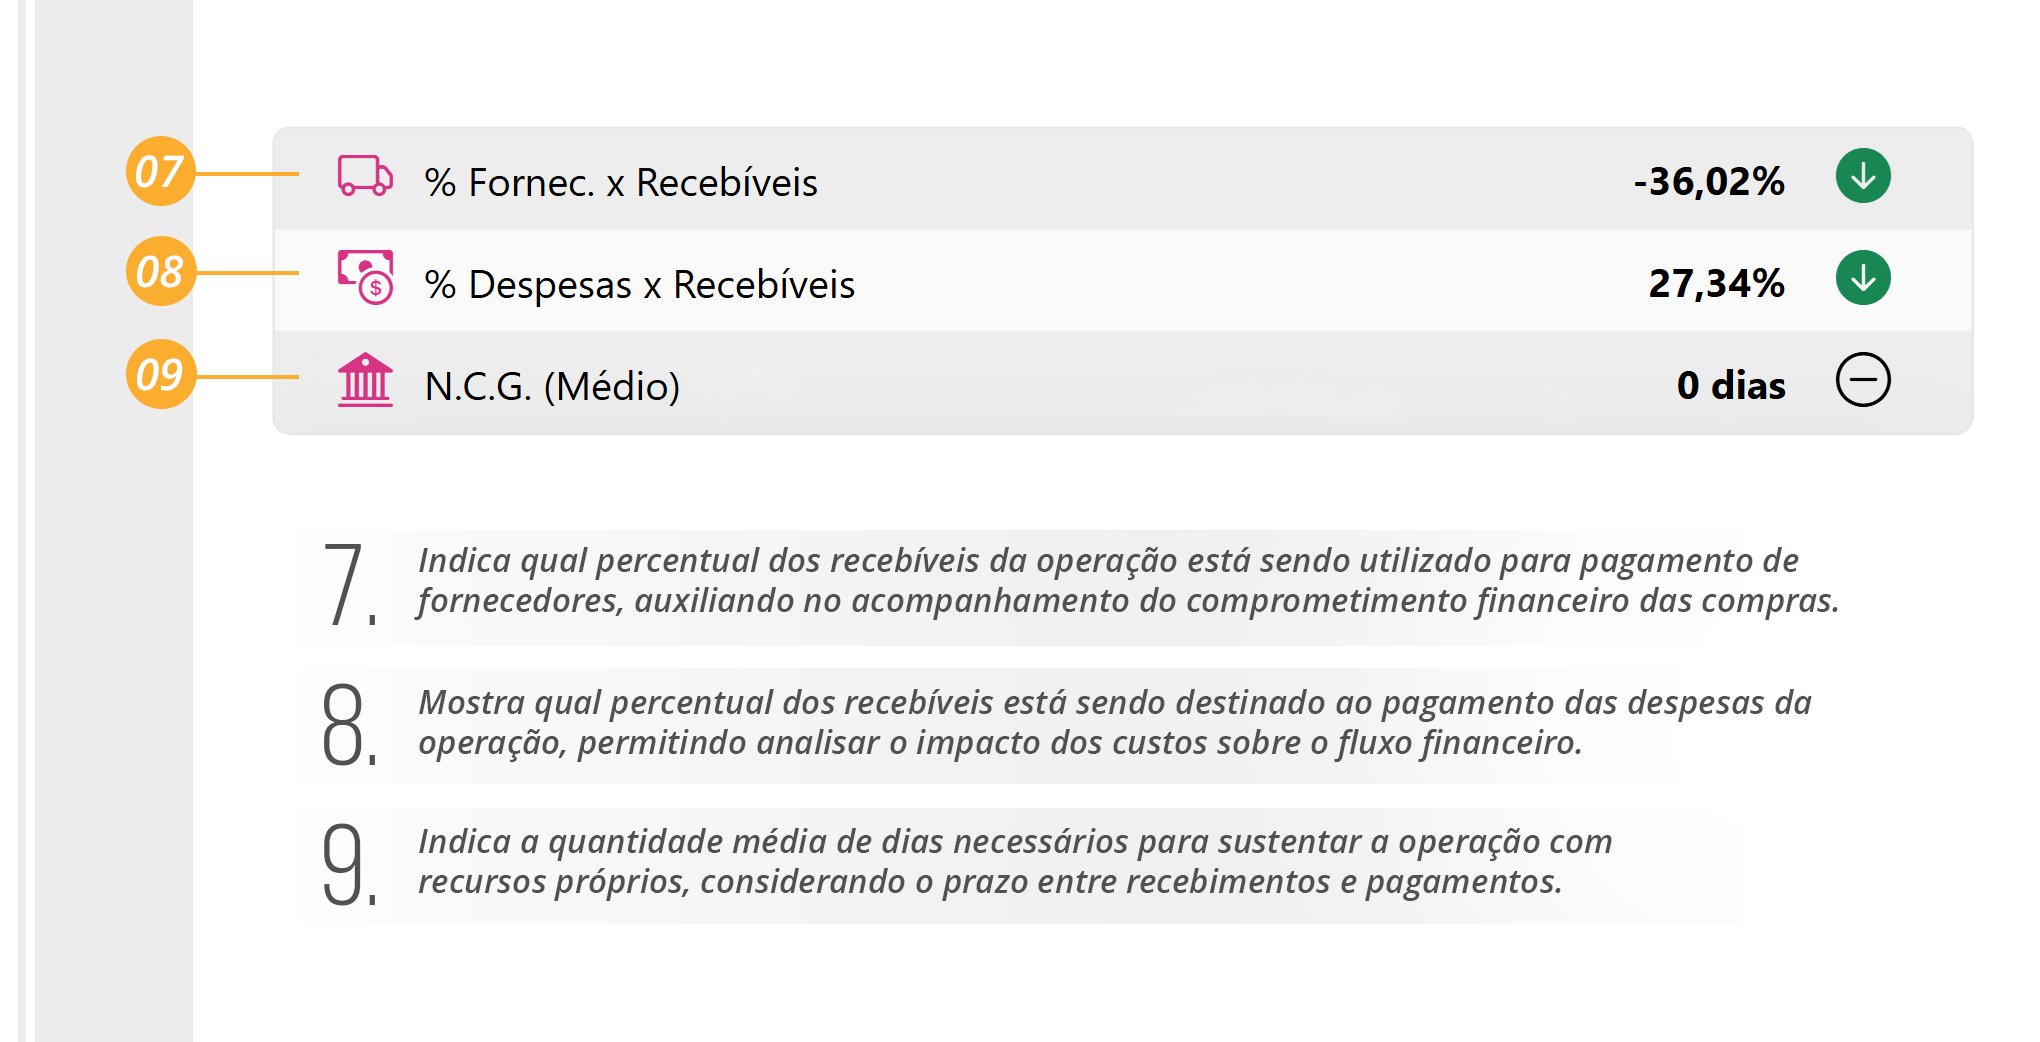
NCG at Zero (Average Payment and Collection Terms Are Equal).
Verifying the EXPENSES Card in Metrics
- In the Metrics report, expenses include all Expense (D) entries due within the period being analyzed, including those already paid and those still payable.
Go to VR Master: Financial / Accounts Payable / Supplier (Date Type: Due Date / Status: All / Type: Expense)
Select/Deselect the Expense to Be Displayed in Controller
- Access VR Master and click the field indicated in the image below, then search for “Entry Type”;
- Follow the steps shown in the image below
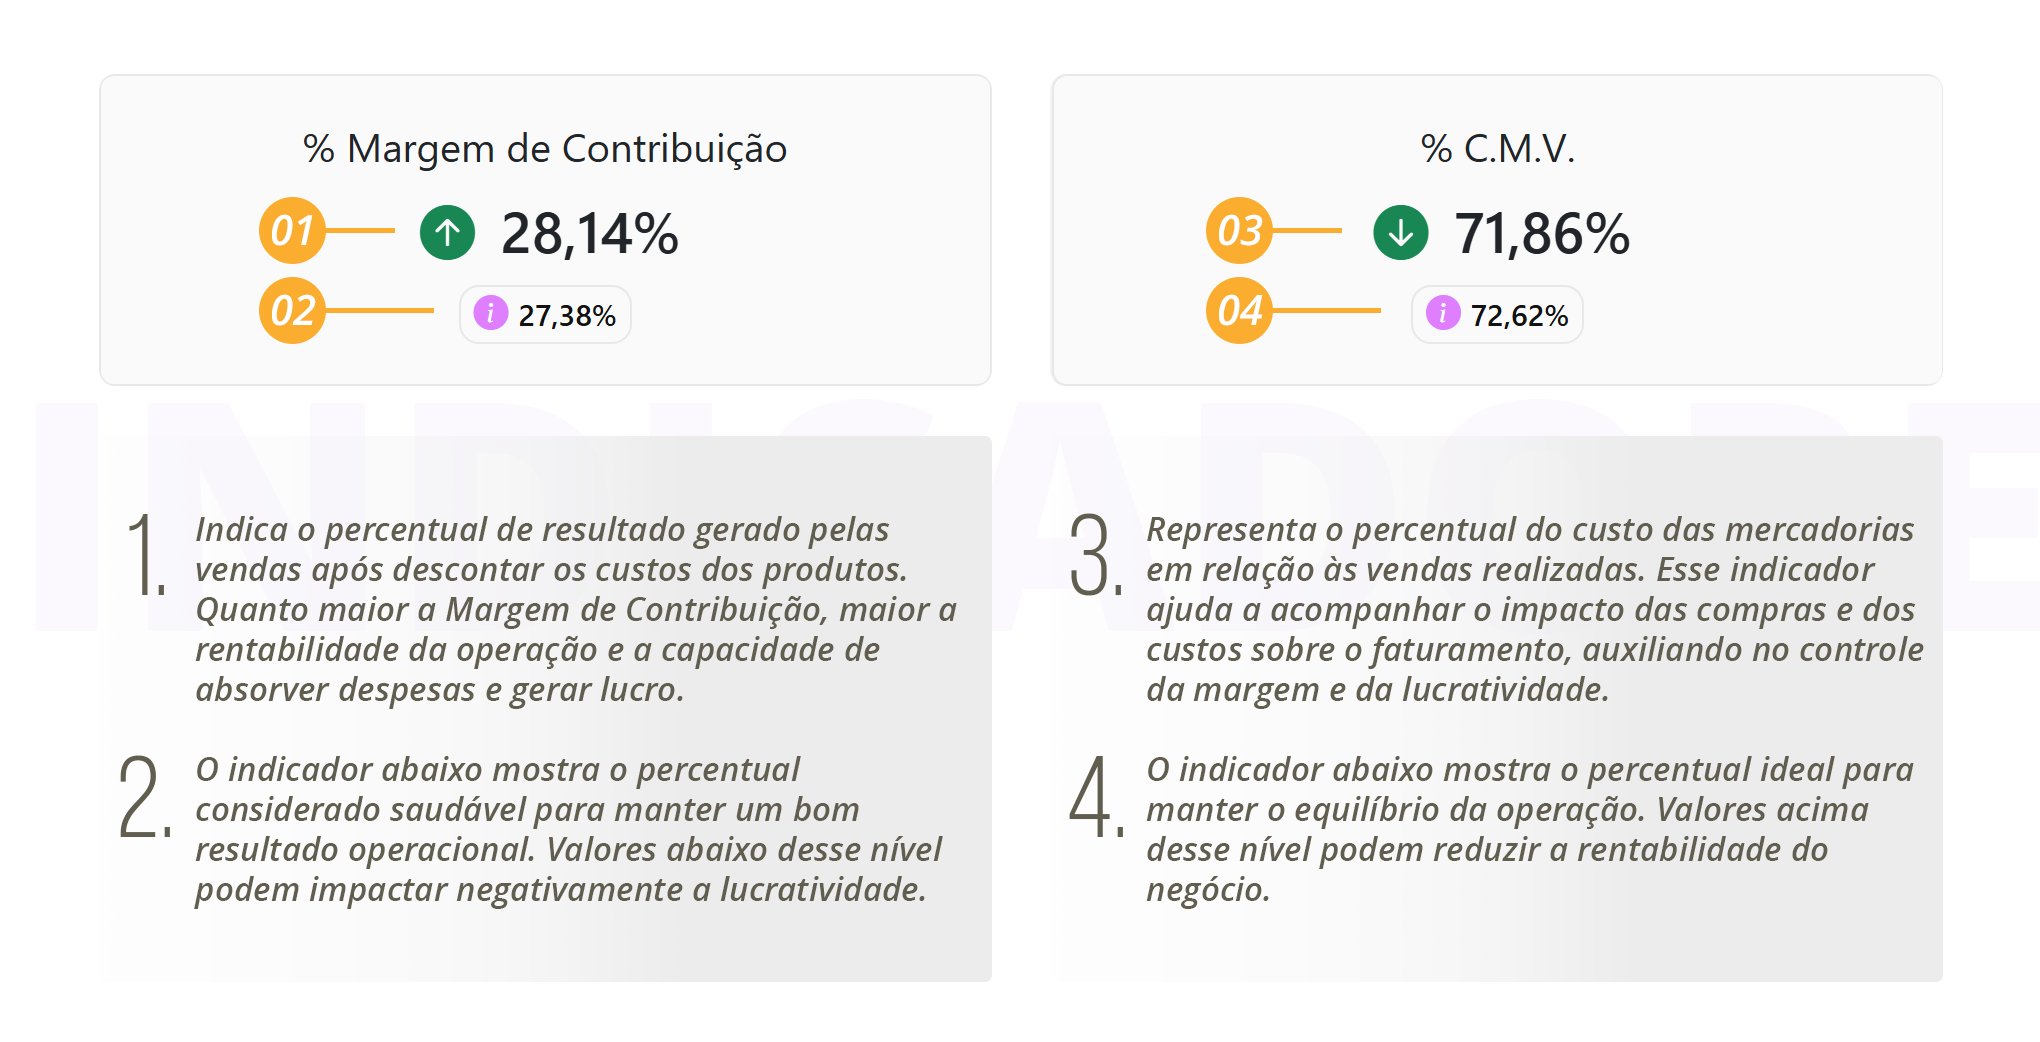
Card Details [%Contribution Margin] and [%COGS]
-
See the details of each Metrics card below;
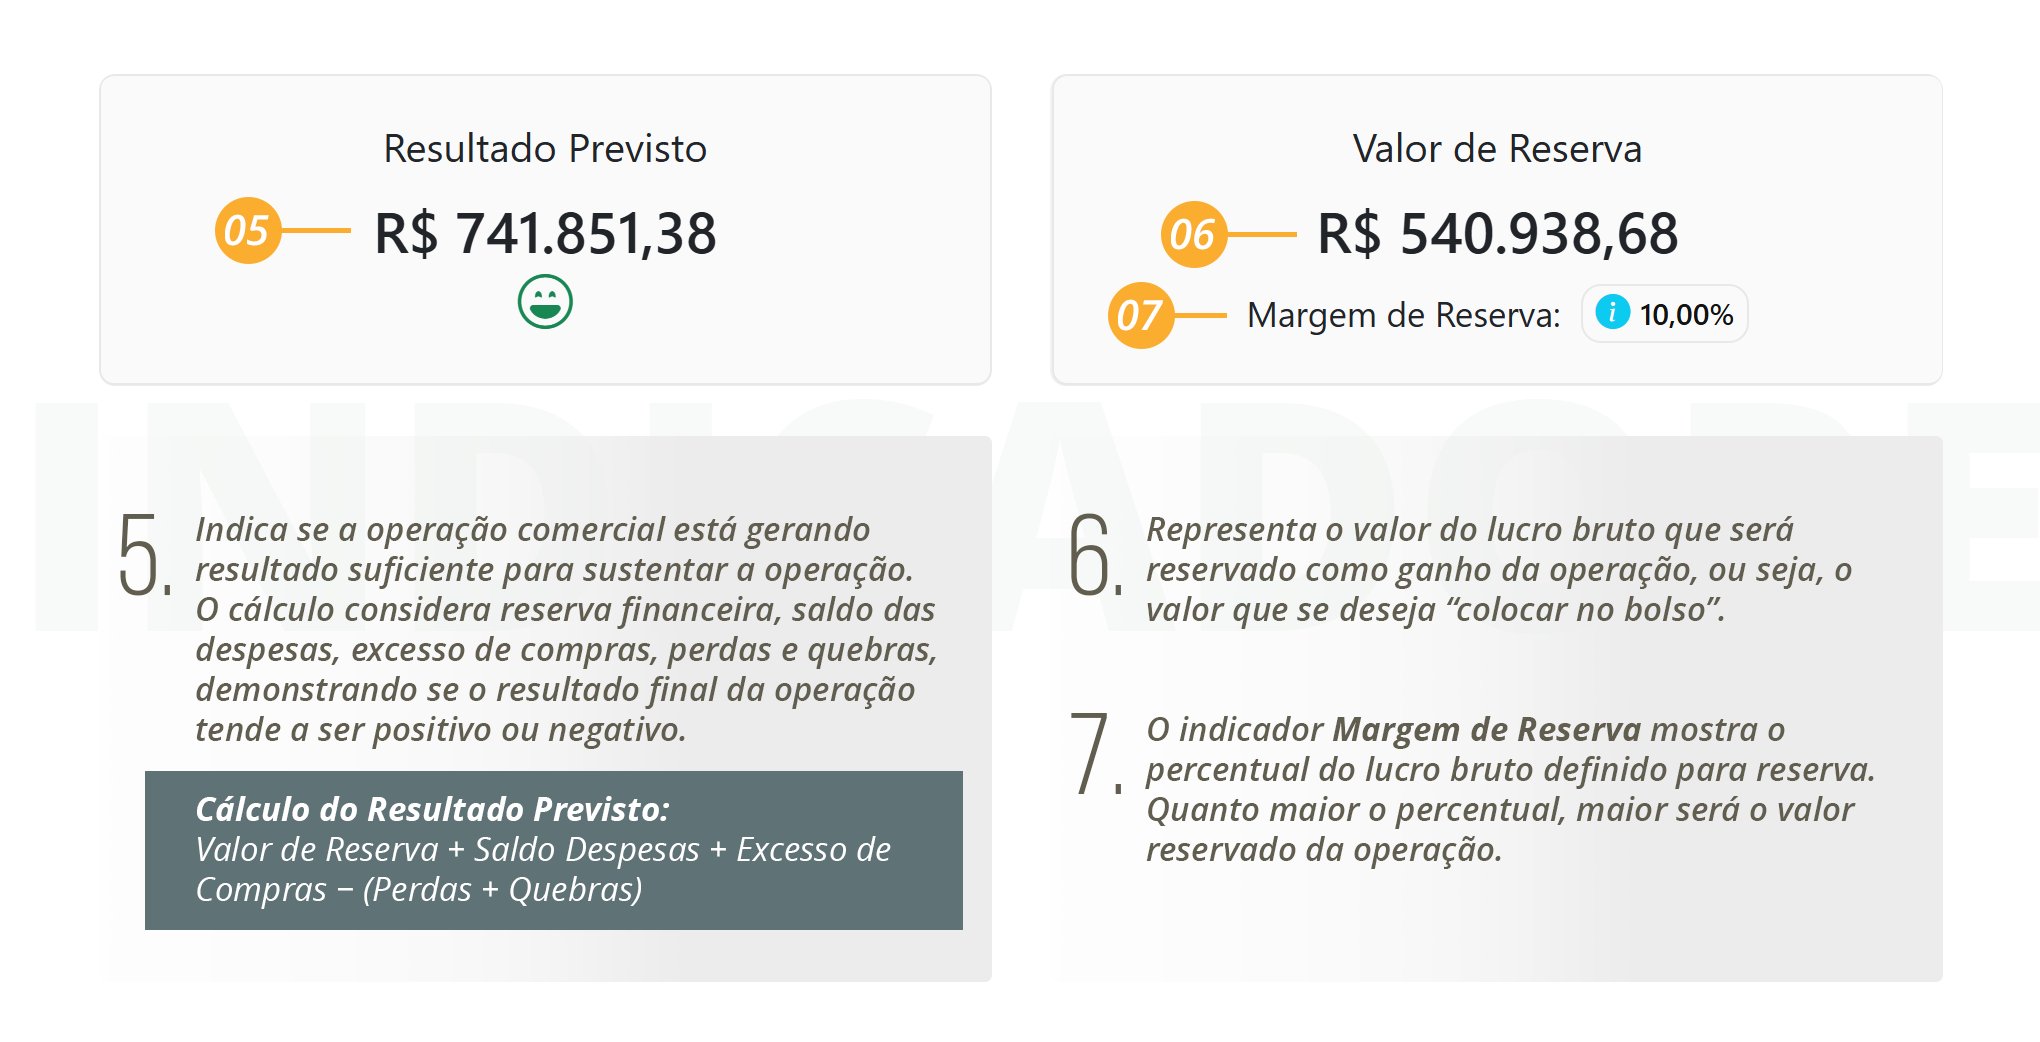
Card Details [Projected Result] and [Reserve Amount]
Variation Calculation
Example: Days 01 to 12/03
-Inventory Variation = Ending Inventory Balance (12) – Beginning Inventory Balance (28/02)
-Variation Percentage = Inventory Variation / Beginning Inventory Balance
1. Note: Information available in VR Master under: Inventory > Inventory Monitoring
2. Note: Regardless of the starting date selected in Metrics, the beginning inventory balance will be the balance at the end of the previous month, which is 28/02 in this example.
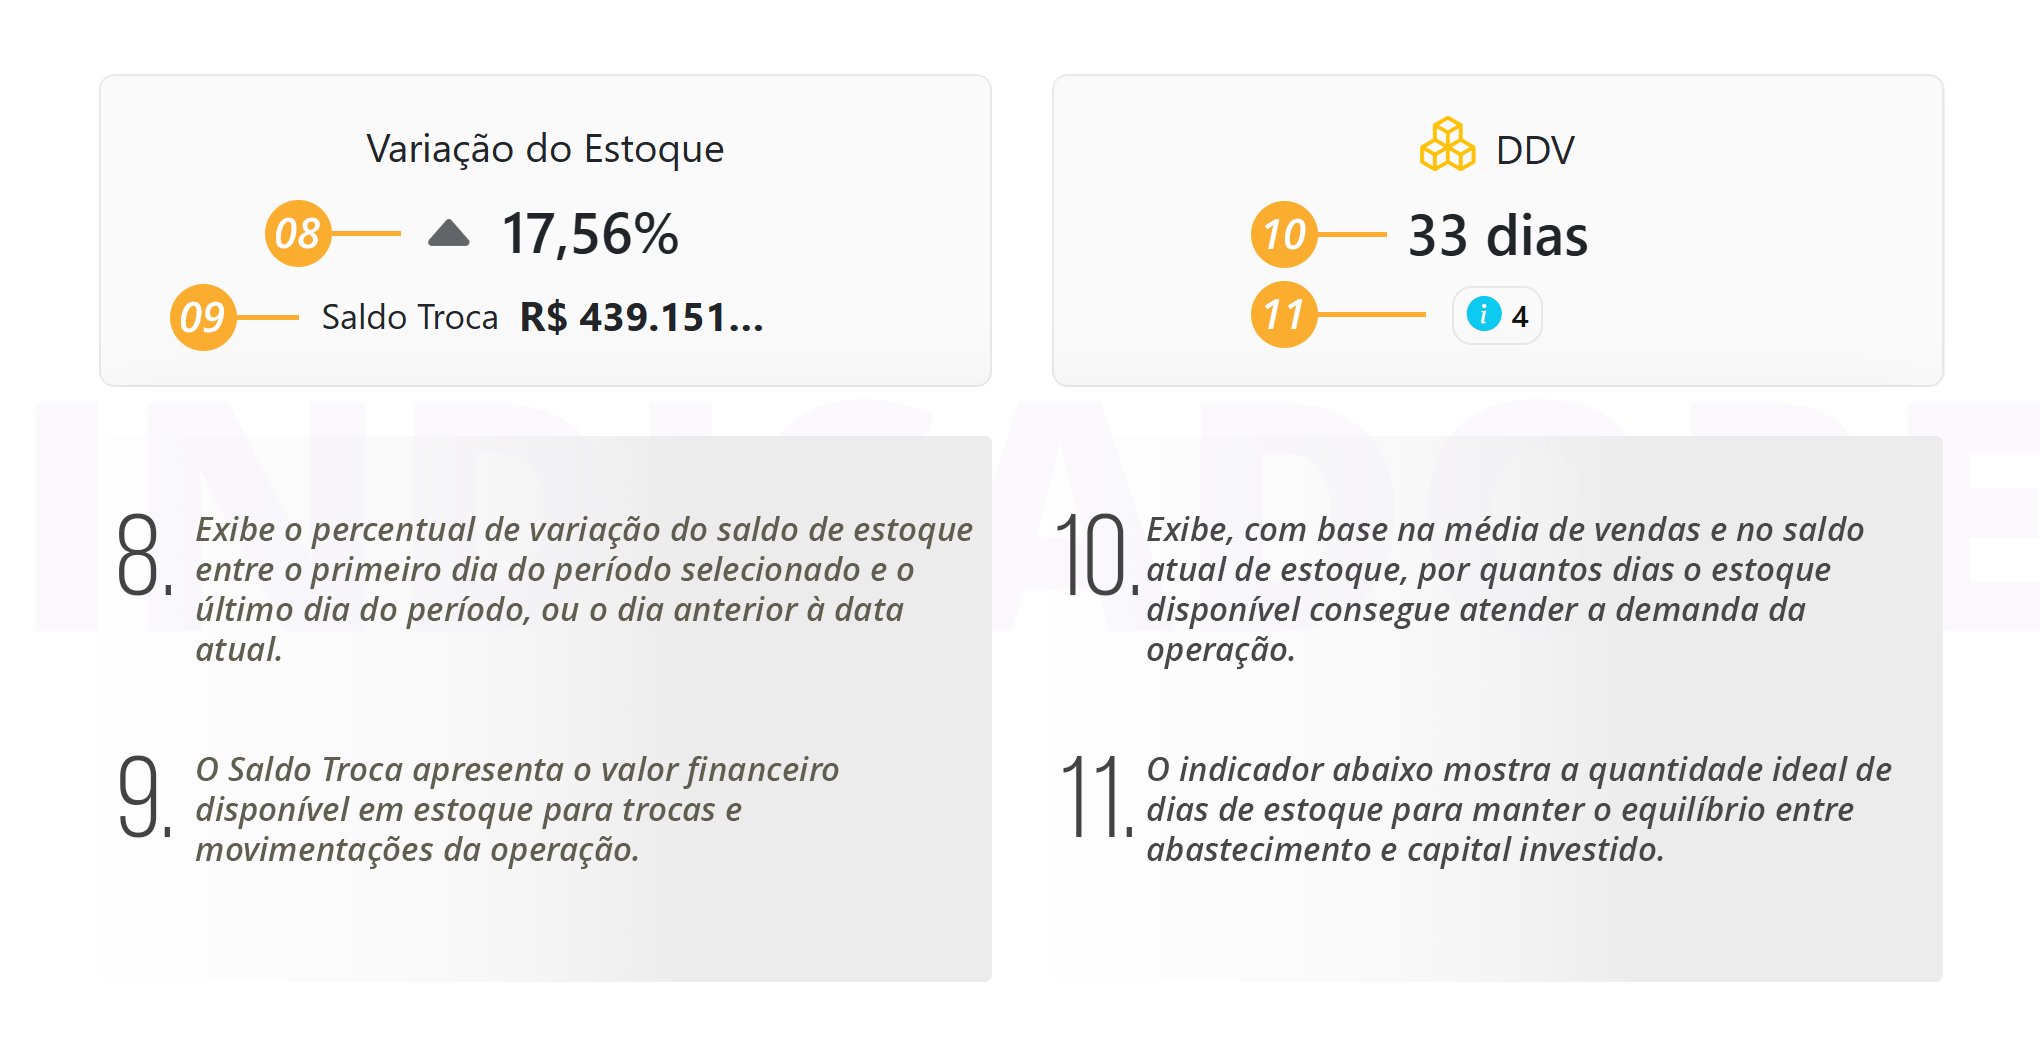
Card Details [Inventory Variation] and [DDV]
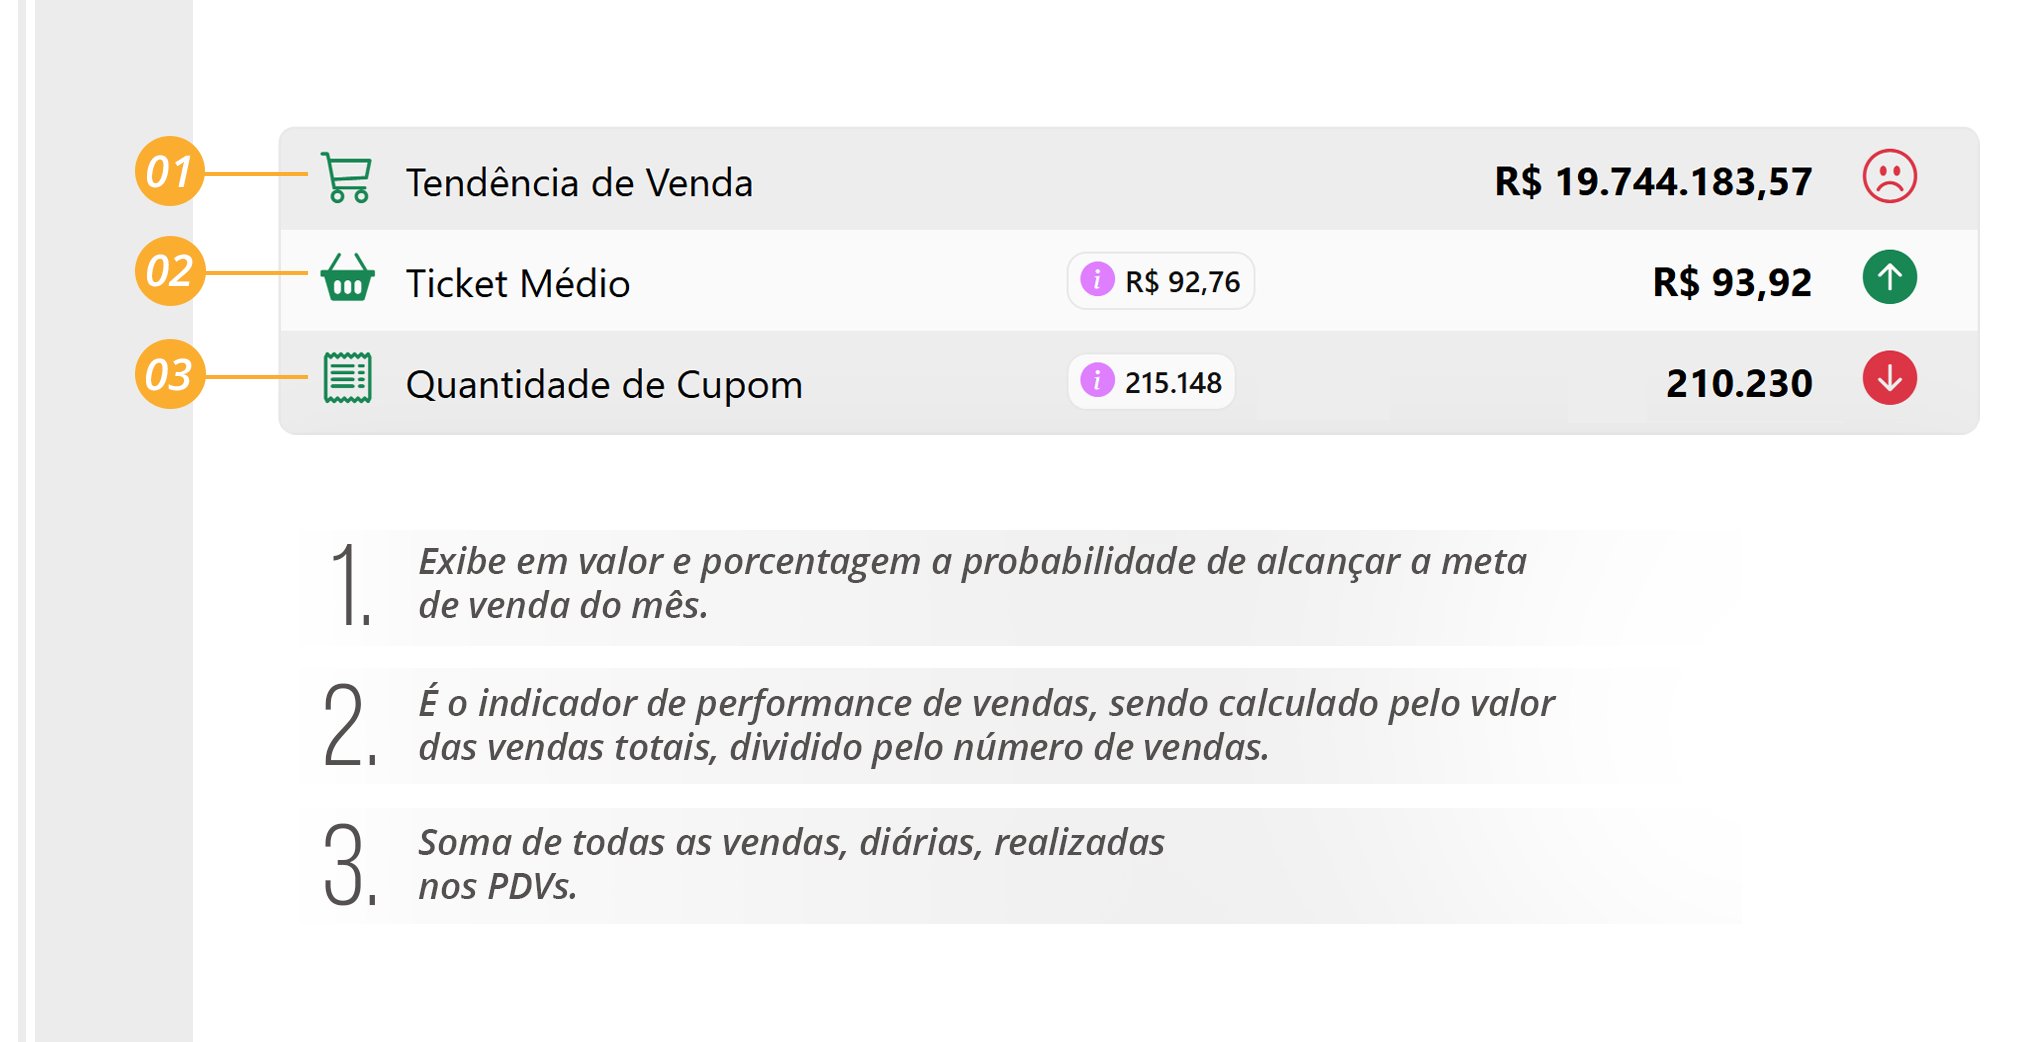
Card Details [Sales Trend]+[Average Ticket]+[Receipt Qty.]
-
See the details of each card below;
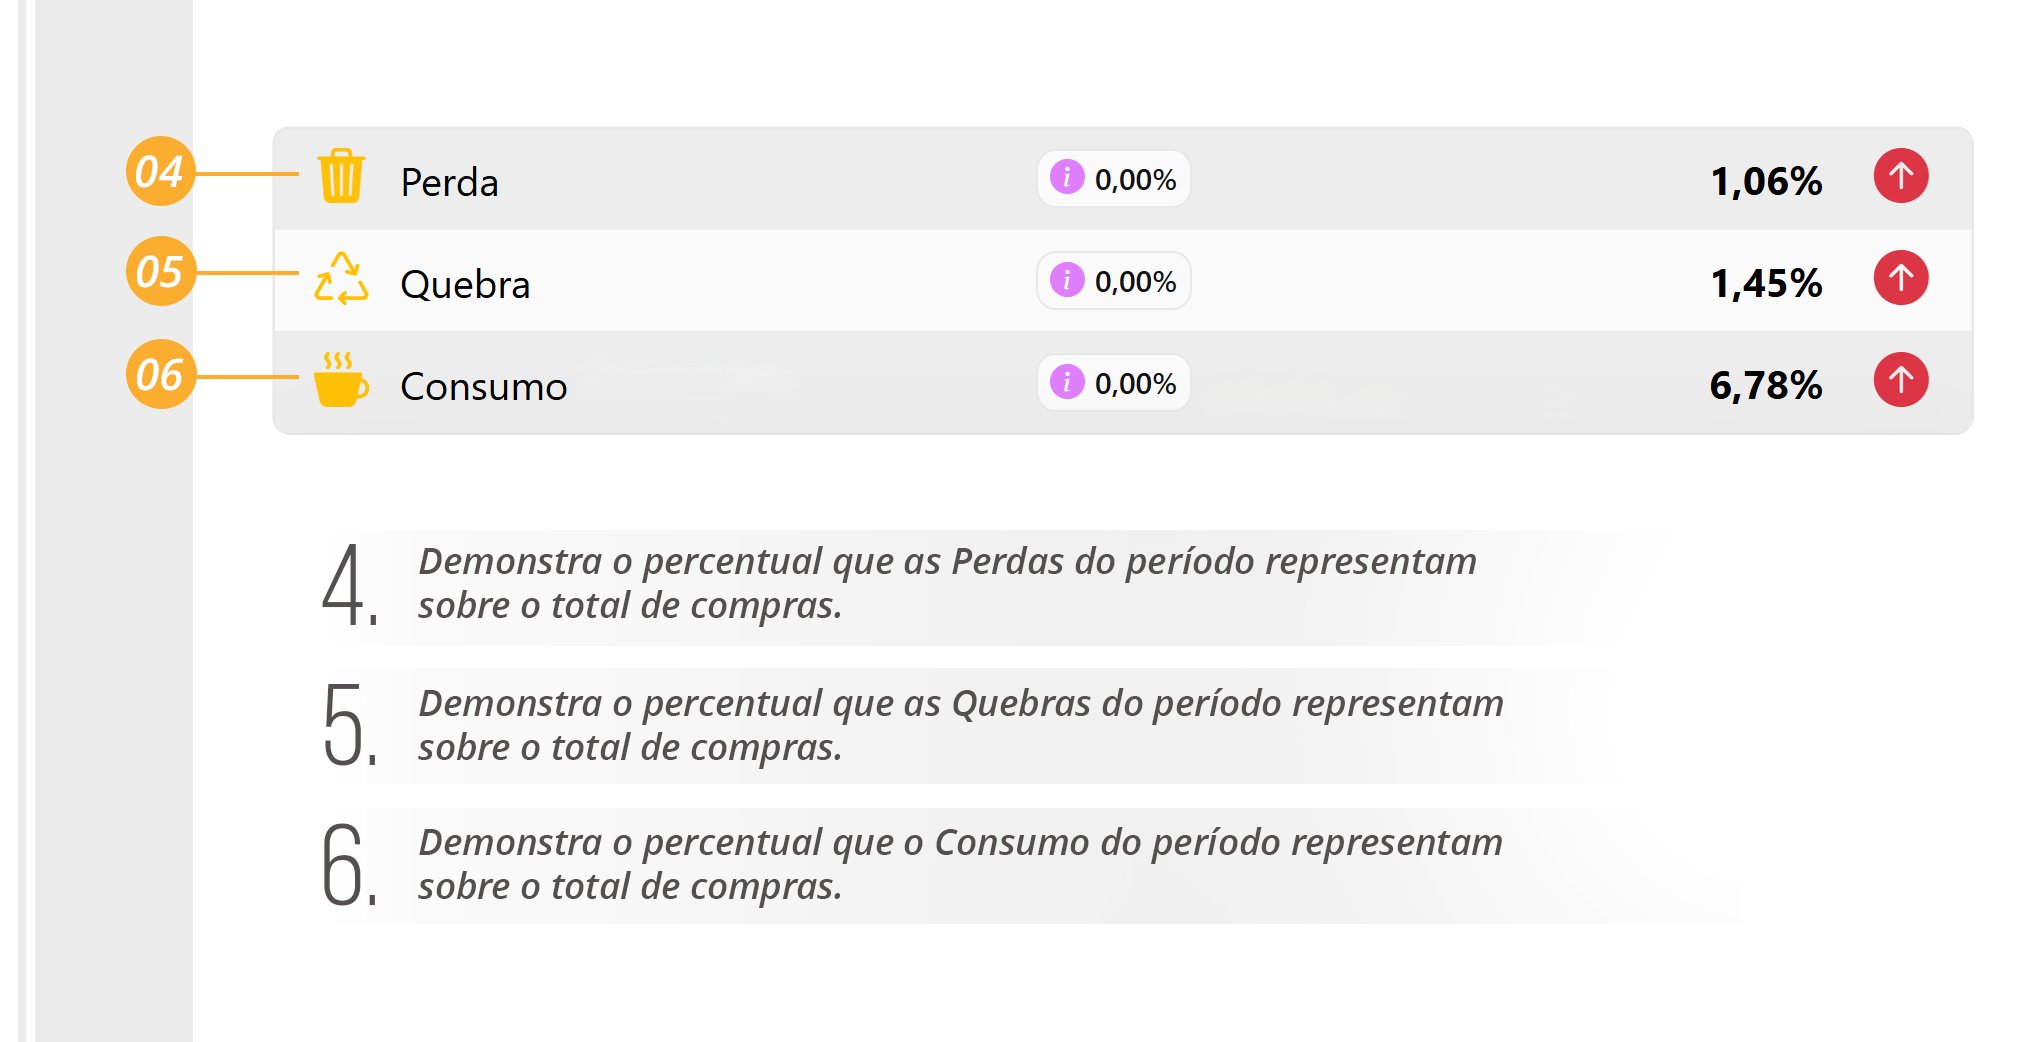
Card Details [Loss]+[Breakage] and [Consumption]
Card Details [Financial Summary]
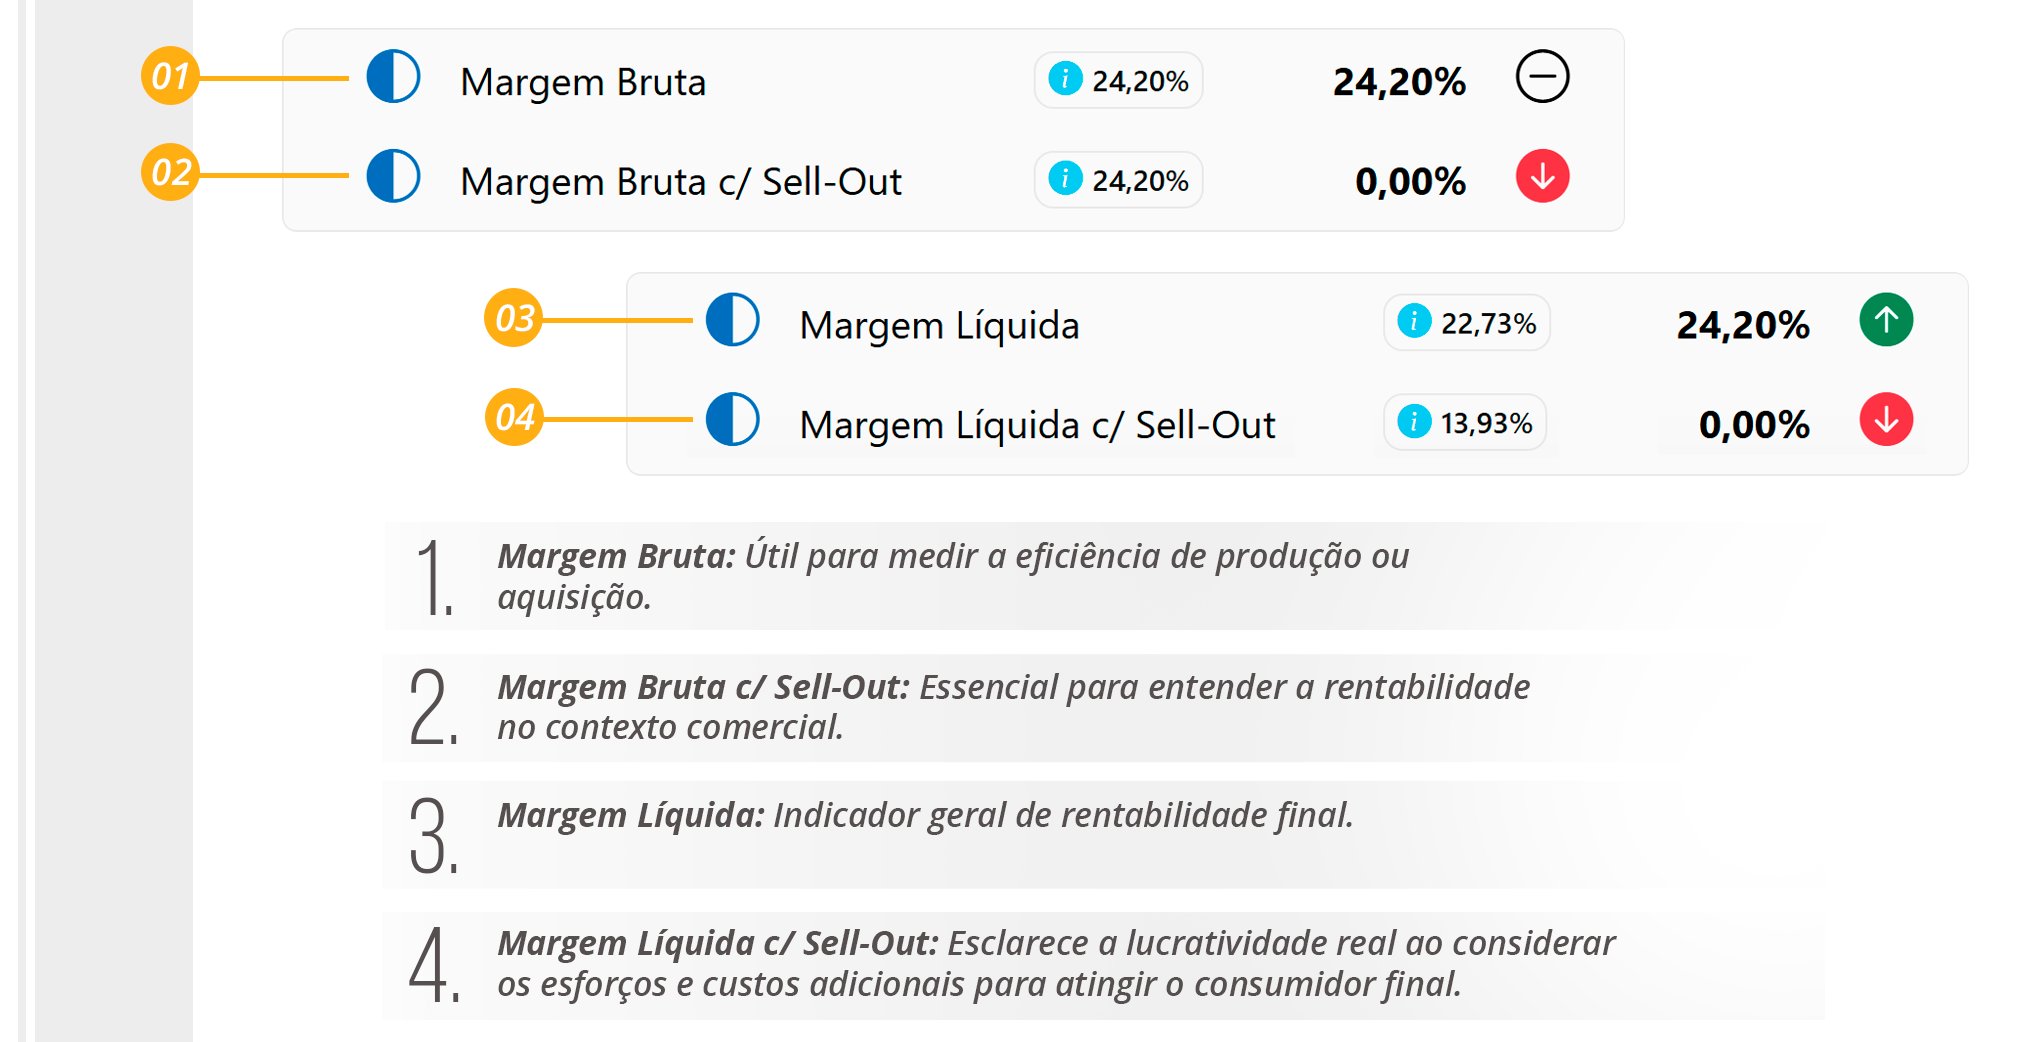
Details of the [Margin] Types
-
See the Margin Details below;
Charts
-
See the details of the [%Promotion Participation] + [%Participation (average) by Payment Method] + [Average Due Date Term] charts
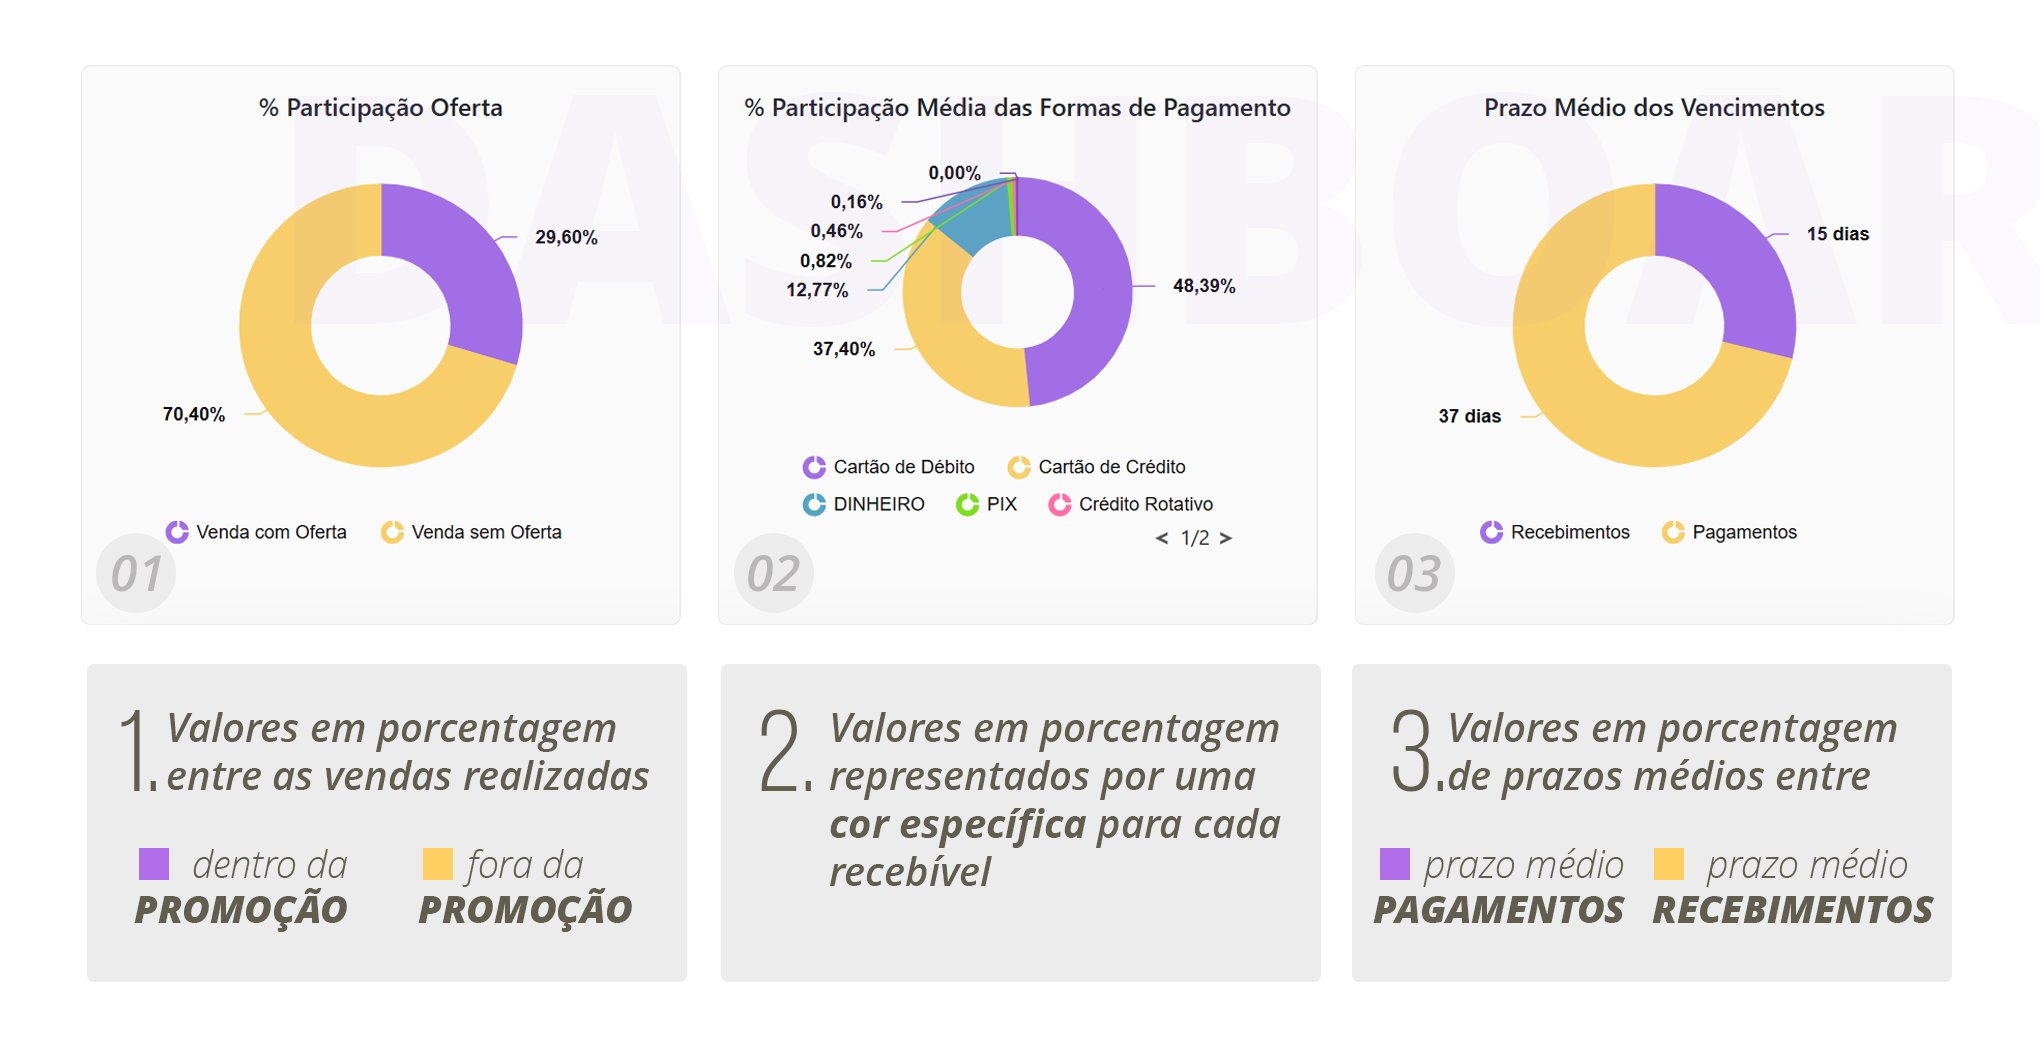
[Target vs. Actual] Analysis Charts
-
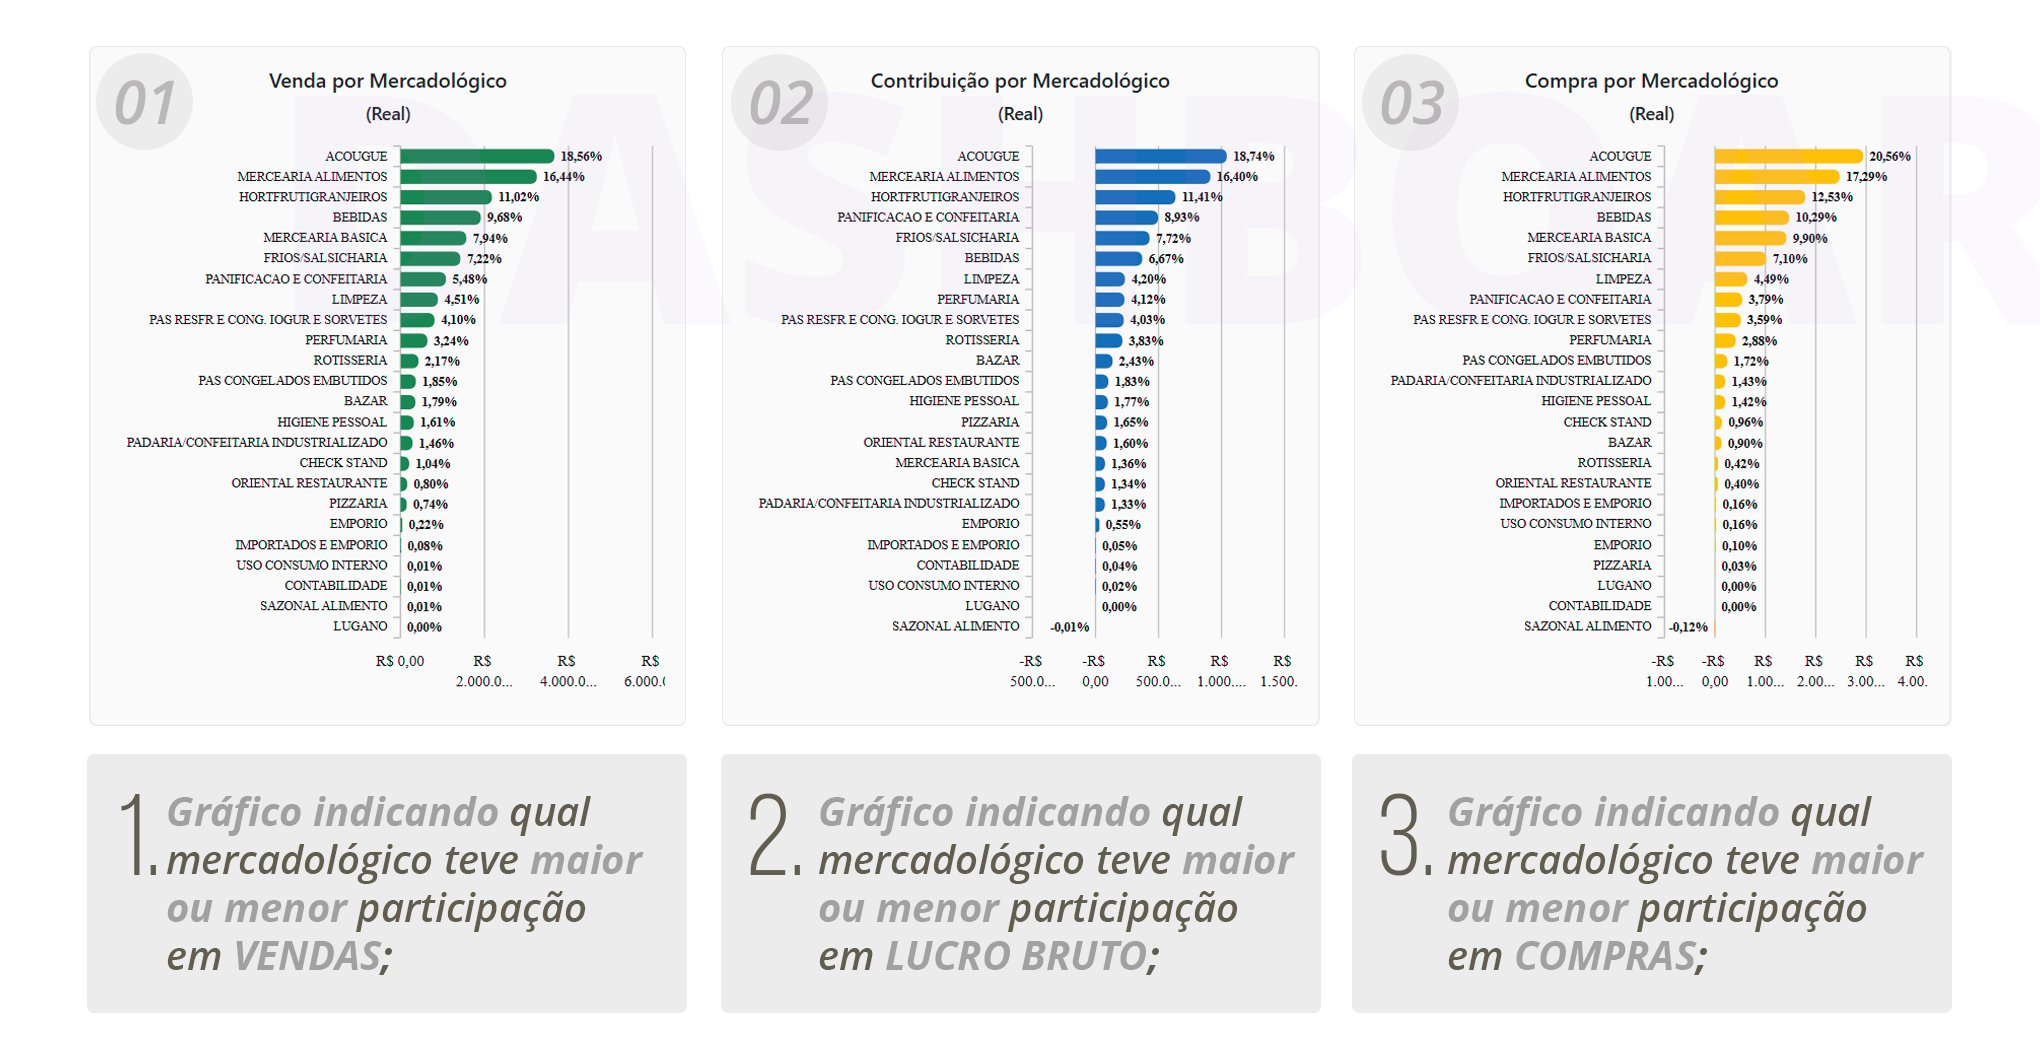
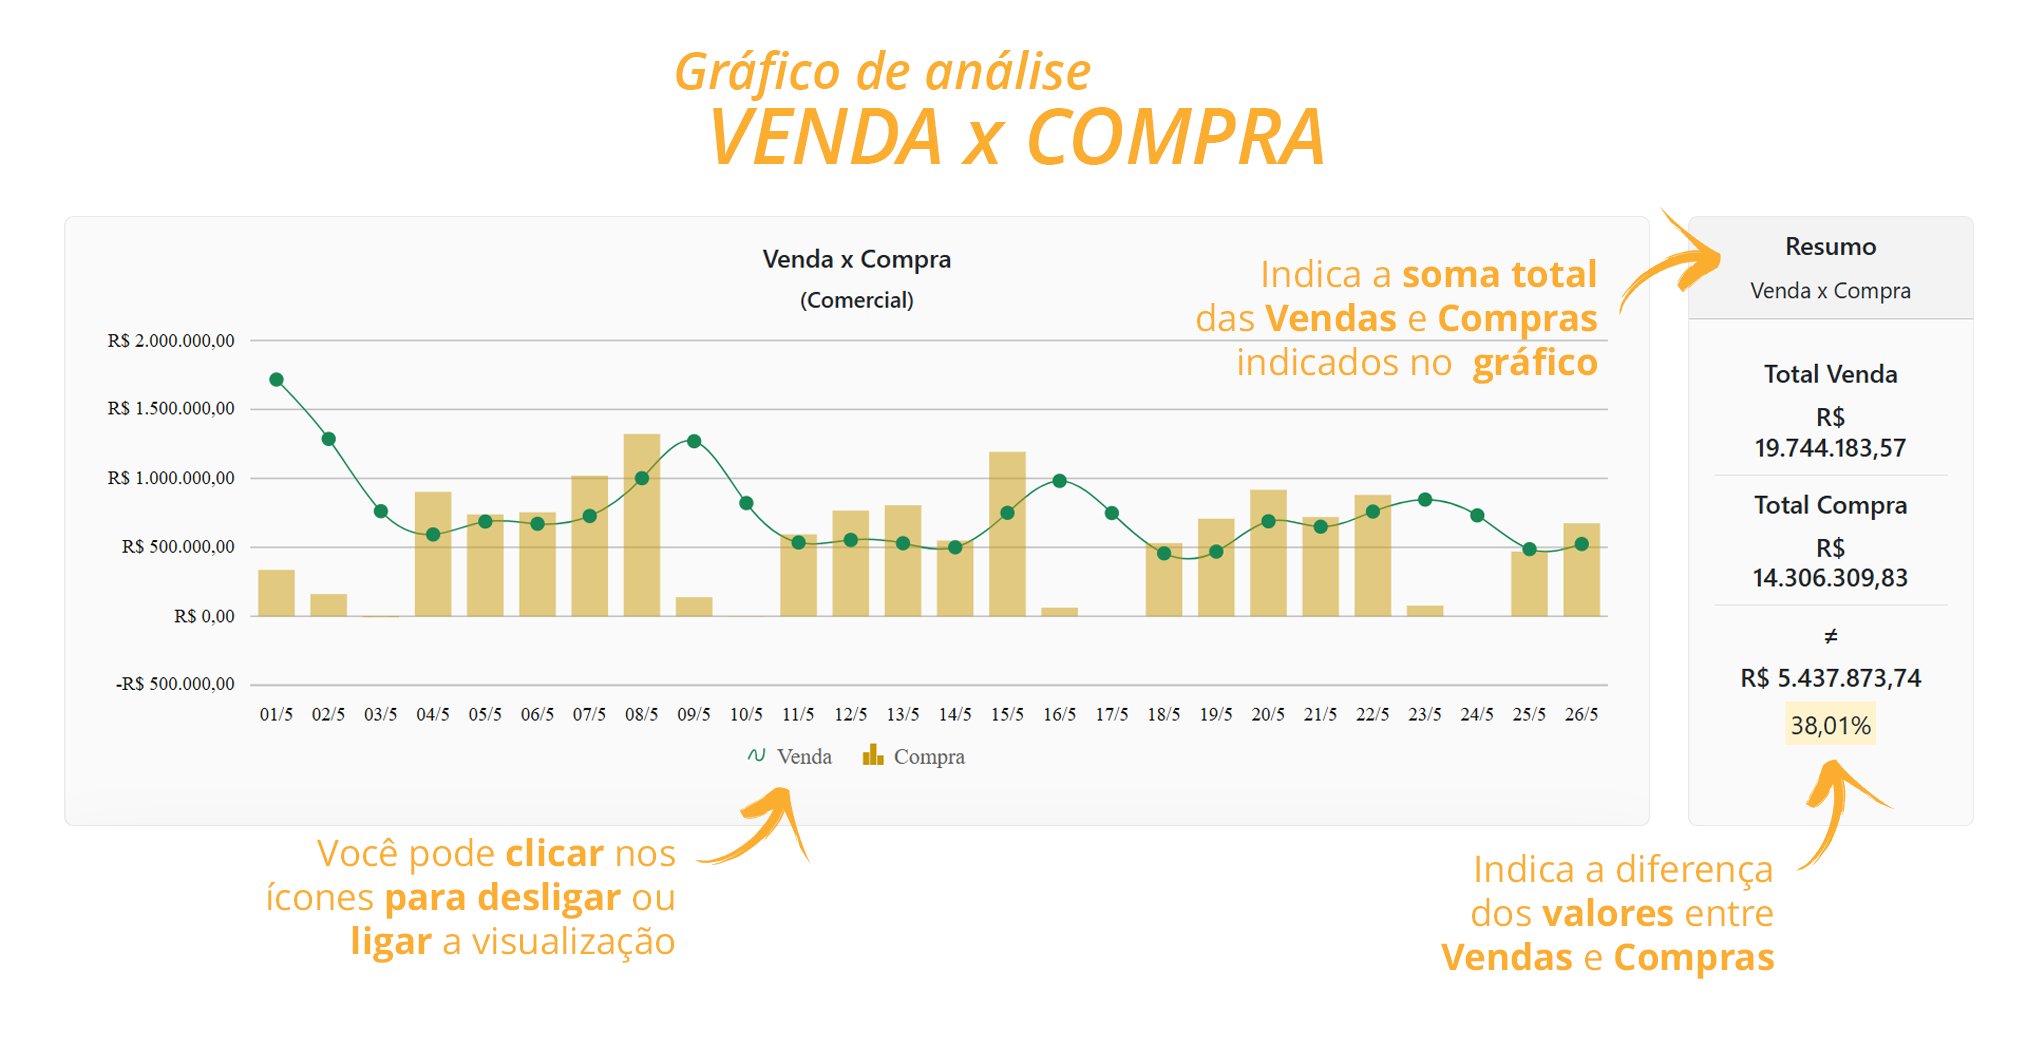
Commercial Monitoring / Merchandising in a CHART;
You can filter the chart view by clicking the icon indicated in the image below. You can now analyze sales targets by merchandising category, as well as Contributions and Purchases;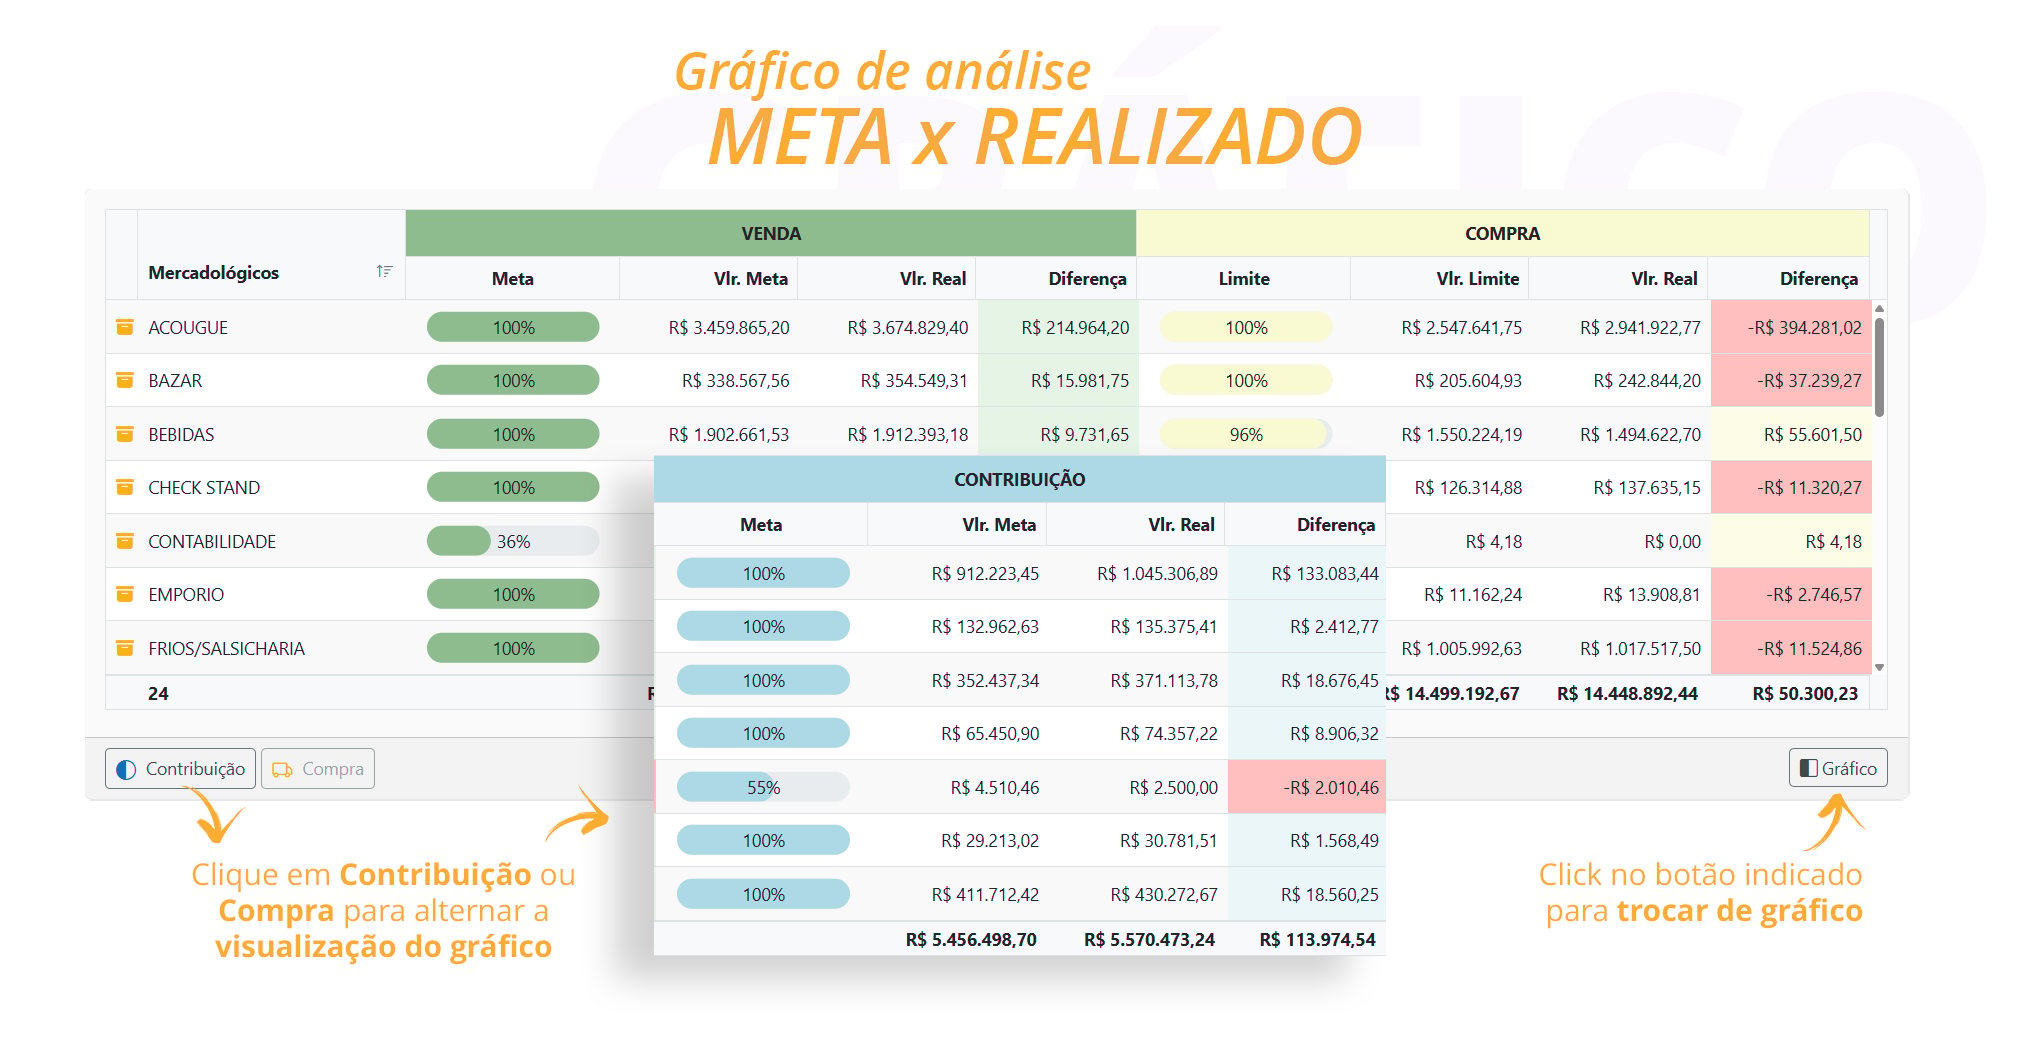
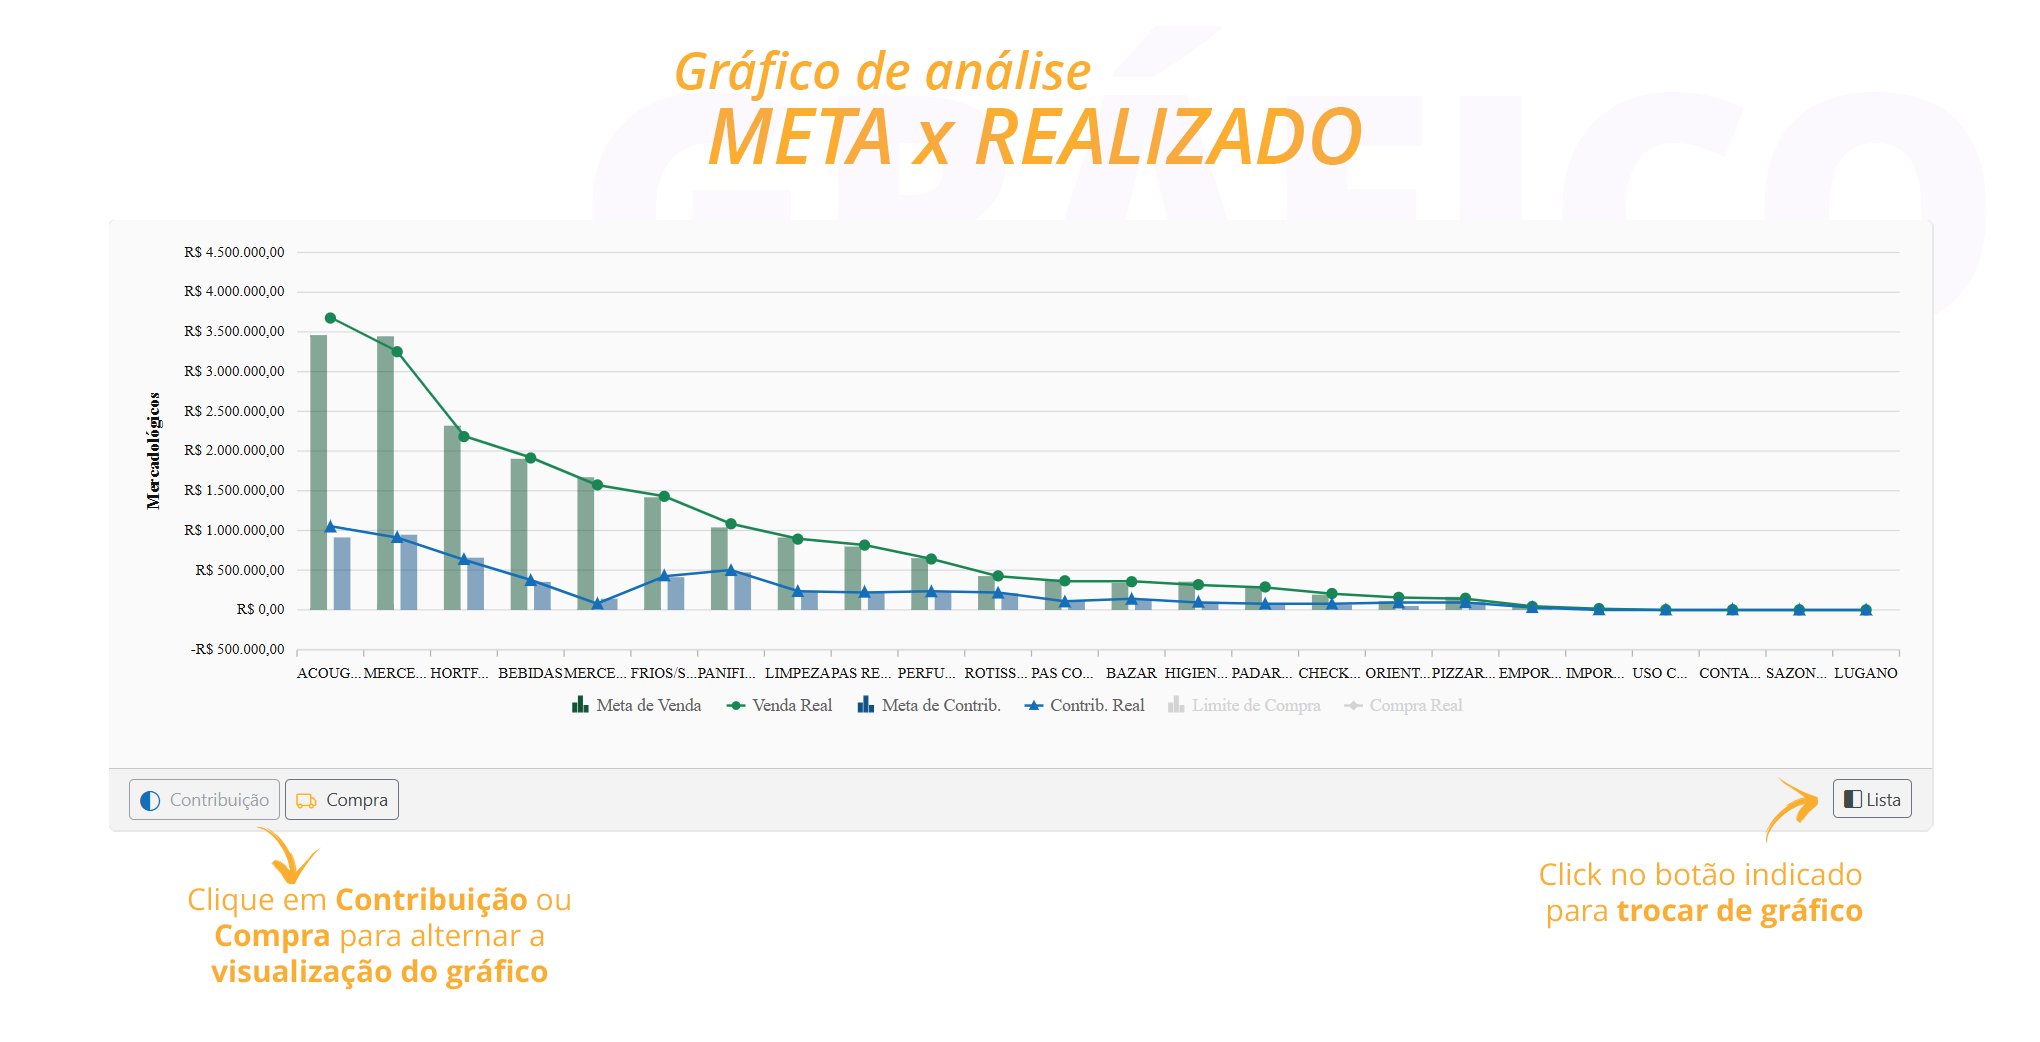
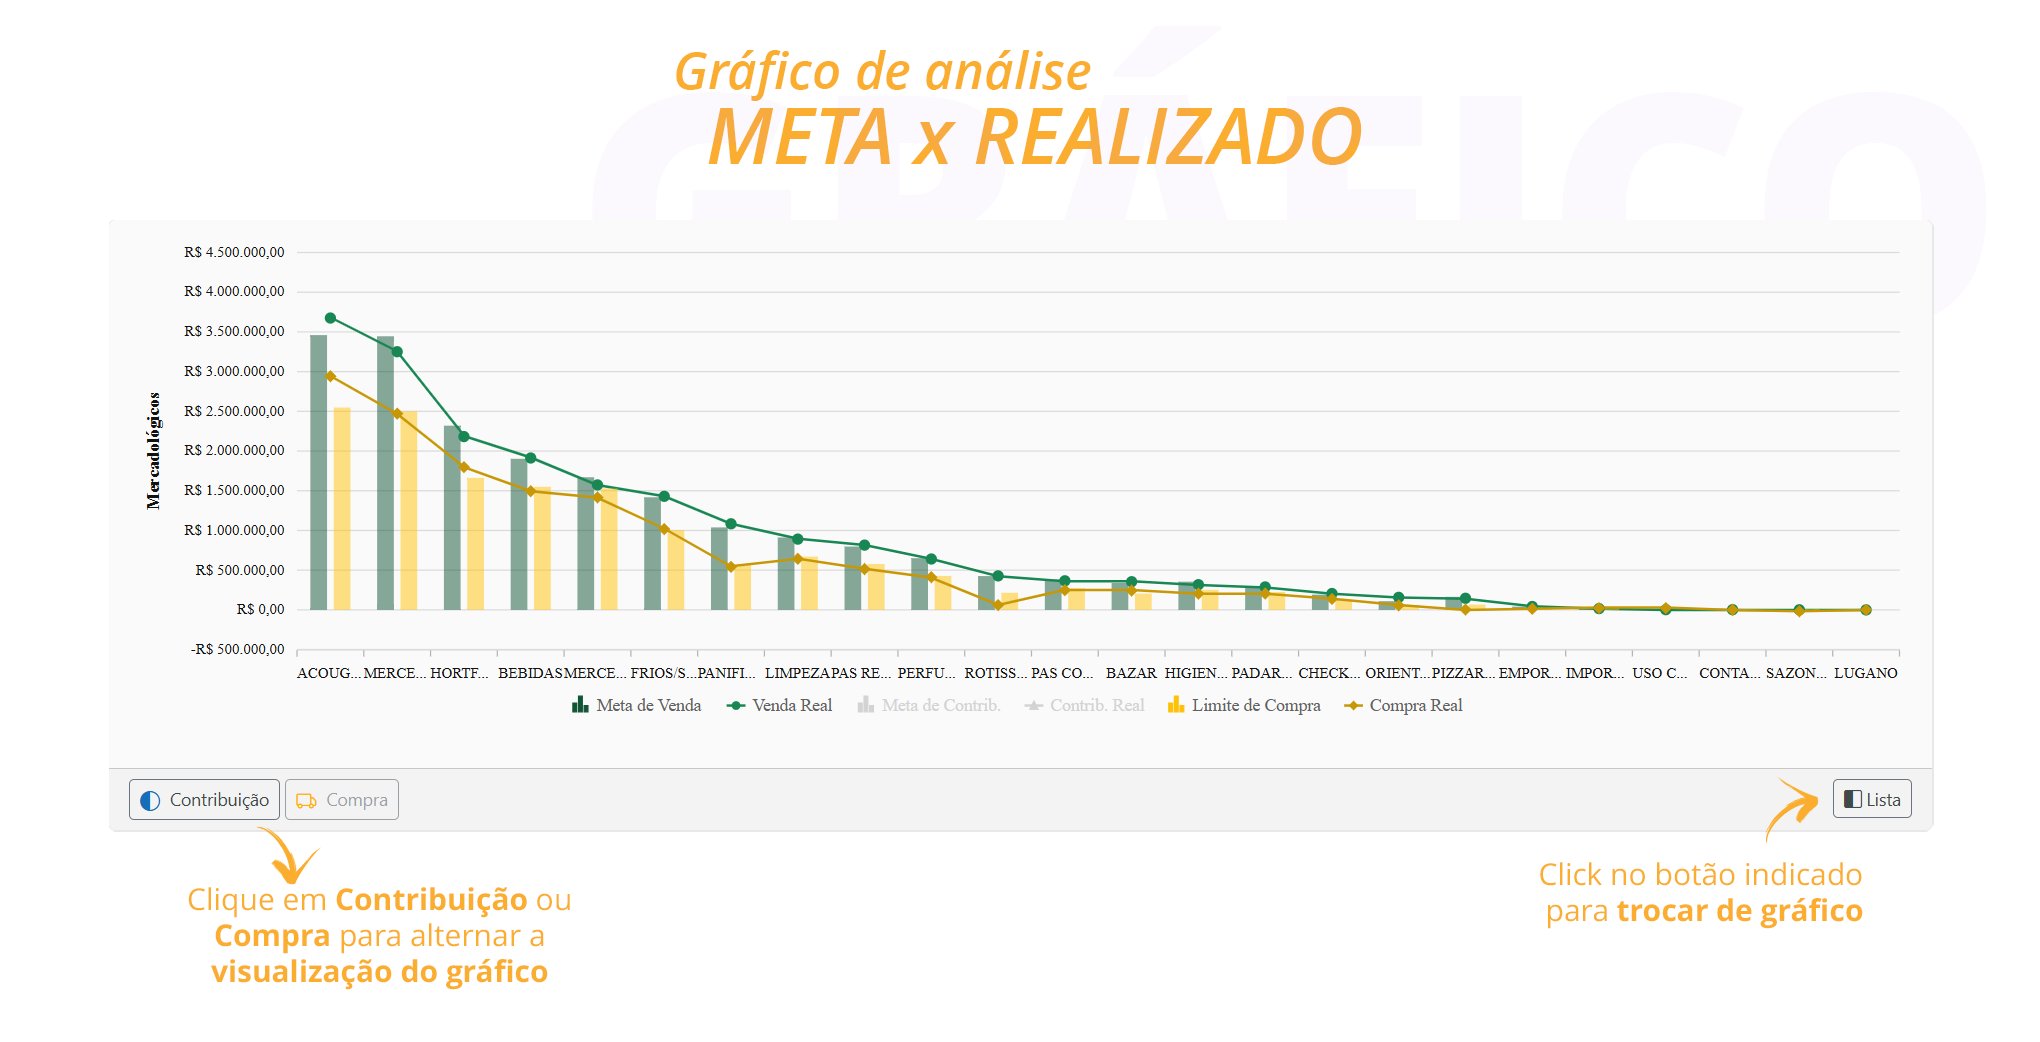
Participation Chart [Sales]+[Contribution] and [Purchases]
Commercial Analysis Chart
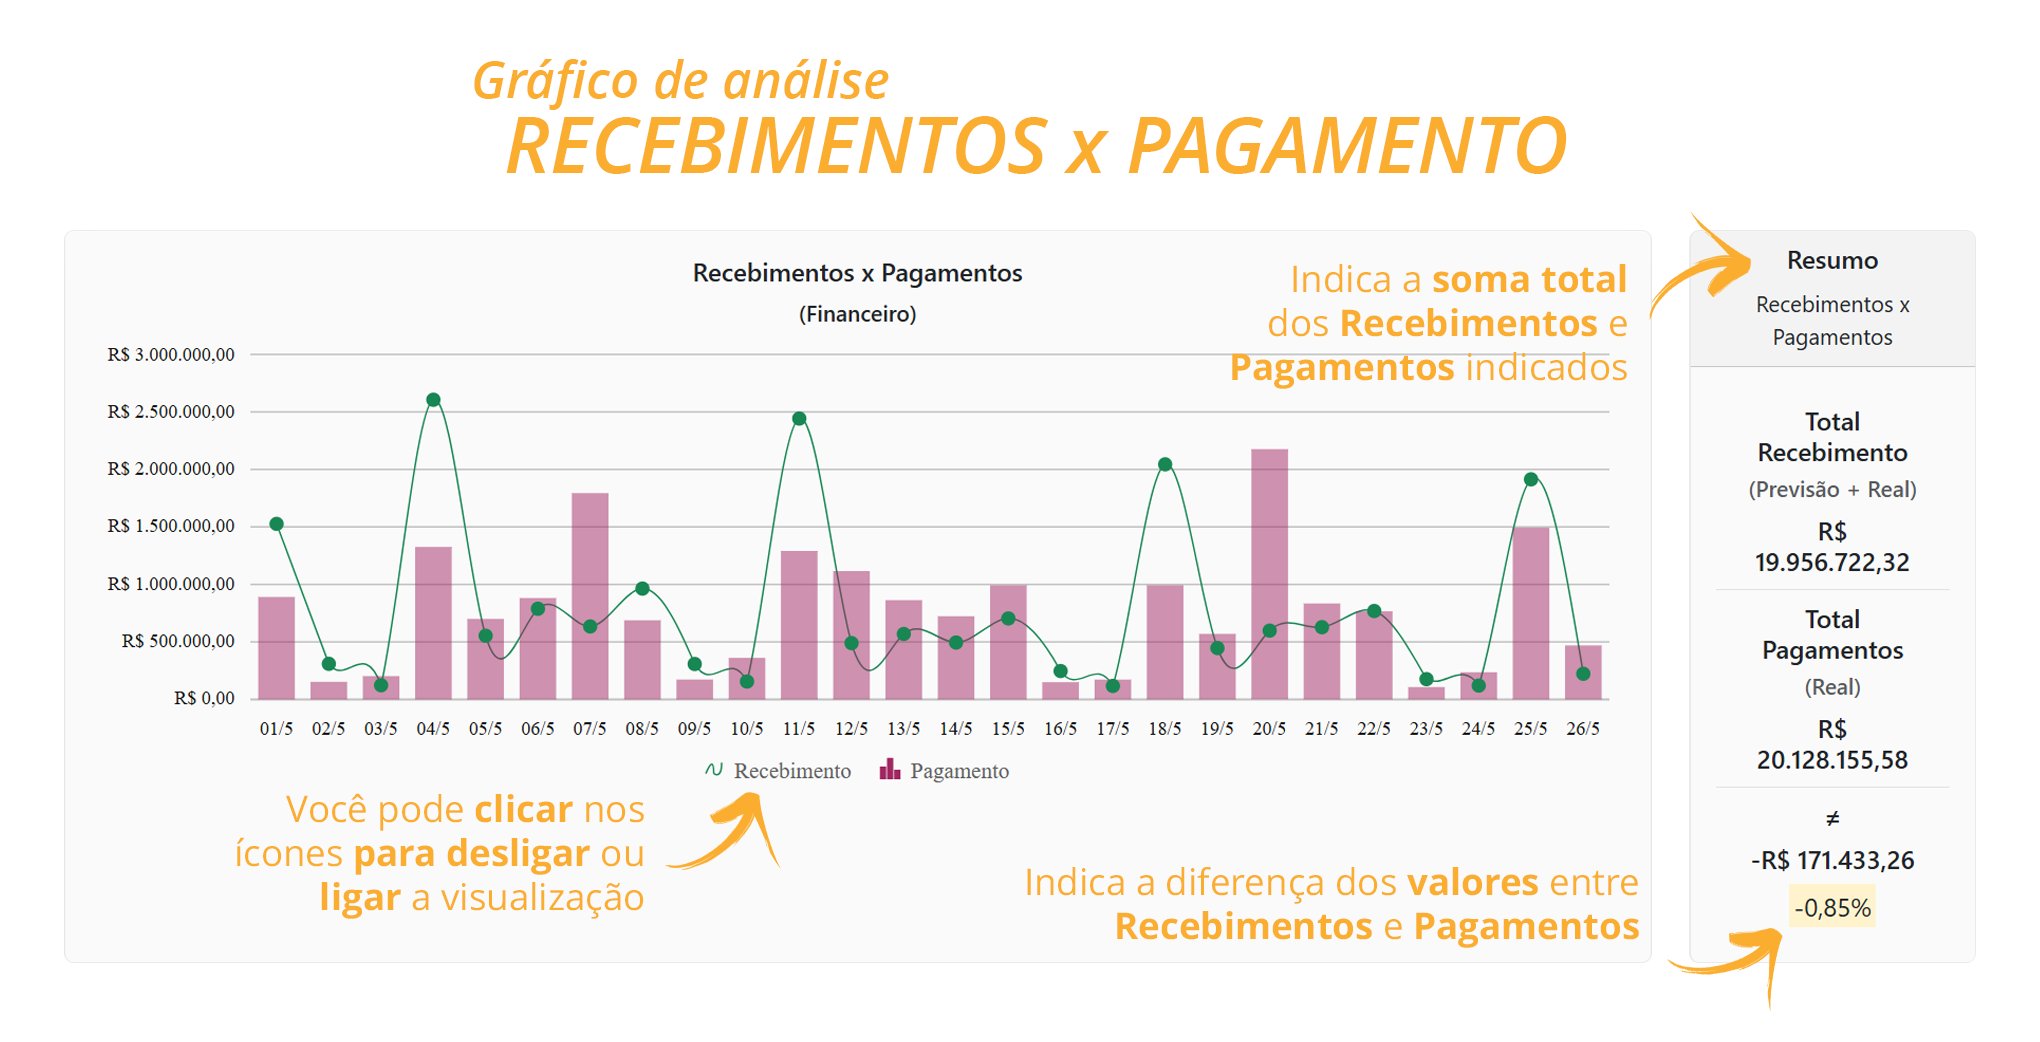
Financial Analysis Chart
Technical Description
The main cards displayed are:- Sales: Displays the sales target, actual sales, the positive difference (within the healthy limit) or negative difference (above the healthy limit), and sales progress according to the selected filter.
- Contribution: Displays the contribution target and the actual contribution margin, also known as Gross Profit, which is the amount available to pay expenses.
- Purchases: Compares budgeted and actual purchases, generating a positive difference (within the healthy limit) or negative difference (above the healthy limit).
- Purchase Limit: Previous month’s balance (optional) + Floating Purchase Limit + Adjustment Amount.
- Accumulated Purchase Limit Balance does not include the previous month’s balance or adjustment amounts.
- Expenses: Daily expense limit based on the daily contribution amount target minus the reserve margin percentage (parameters).
- Accumulated Sales: Displays accumulated sales from the most recent consistency check. A green and happy face indicates accumulated sales above the budget, while a red and sad face indicates accumulated sales below the budget.
- % Contribution Margin: Compares the budgeted and actual contribution margin. When the arrow is green, it points upward, indicating that the actual amount is greater than the budgeted amount and that your margin has improved. When the arrow is red, it points downward, indicating that the actual amount is lower than the budgeted amount.
- % C.O.G.S.: Compares the budgeted and actual cost of goods sold. When the arrow is green, it points downward, indicating that the actual amount is lower than the budgeted amount and that your COGS percentage has decreased. When the arrow is red, it points upward, indicating that the actual amount is greater than the budgeted amount and that your costs have increased.
- _Inventory Variation:_Displays the percentage difference between the inventory balance on the first day of the selected month and the last day of the selected period or the day before the current date.
- DDV: Displays, based on average sales and the inventory balance, how many days of sales the current inventory will last.
- Accumulated Purchases: Displays accumulated purchases from the most recent consistency check. A yellow face indicates accumulated purchases below the budgeted limit, while a red and sad face indicates accumulated purchases above the budgeted limit.
- % Suppliers: Compares suppliers payable against projected receivables. The result is displayed as a percentage. If it is higher than the COGS percentage, it will be highlighted in red, meaning that more supplier payments are becoming due than can be paid according to the receivables projection.
- % Expenses: Compares expenses payable against projected receivables. The result is displayed as a percentage. If it is higher than the Contribution Margin percentage, it will be highlighted in red, meaning that more expenses are becoming due than can be paid according to the receivables projection.
- Average Ticket: A sales performance indicator calculated by dividing the total sales amount by the number of sales.
- Receipt Quantity: The sum of all daily sales completed at the POS terminals.
- % Loss: Displays the average loss recorded in inventory and compares it with the average loss from recent months.
- % Breakage: Displays the average breakage recorded in inventory and compares it with the average breakage from recent months.
- % Consumption: Displays the average consumption recorded in inventory and compares it with the average consumption from recent months.
- Average Payment Term: The average time between the issue date and the due date of completed purchases.
- Average Collection Term: The average time between the issue date and the due date of receivables (Cash, Credit Card, Debit Card, Check, Revolving Credit, and Credit Sales).
- Projected Result: The sum of the reserve amount (VC * MR), expense balance, and total excess purchases, minus loss and breakage.